Operational Definitions for Variable Measurement
Learn about operational definitions in psychological research to measure variables effectively, using examples of safe driving and psychological distress. Explore the distinction between latent and observed variables and the complexities of measuring latent variables with multiple indicators. Gain insights into the advantages and disadvantages of using various indicators to assess latent constructs.

Operational Definitions for Variable Measurement
E N D
Presentation Transcript
Operational Definitions • In our last class, we discussed (a) what it means to quantify psychological variables and (b) the different scales of measurement used for categorical and continuous variables.
Simple Example • Today we’re going to discuss operational definitions. • Let’s begin by assuming we’re interested in the question of whether the use of cell phones while driving impairs safe driving.
Definition of an Operational Definition • There are many ways we could potentially measure “safe driving” • Examples • It is critical that the set of rules, or operations, that we use to measure a variable be as explicit, concrete, and as quantifiable as possible. • These rules, or operations, constitute the operational definition of a variable.
Complex Example • Safe driving is a relatively simple example because it doesn’t involve references to abstract concepts. • Now let’s consider a more complex, abstract variable: psychological distress.
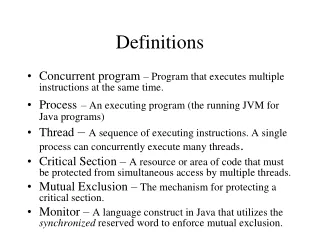
Important Distinction • Latent vs. Observed variables • An observed variable, like using a cell phone, is directly observable and can be measured relatively easily once observers agree upon what counts as an instance of using a cell phone and what does not. • A latent variable or construct, such as stress, is not directly observable. Instead, it is inferred from variables that can be observed.
Measuring Latent Variables • Latent variables can be measured, but their measurement is much more complicated than that of observed variables. • The first thing we need to do is identify the indicators of the latent variable (i.e., the observable consequences or manifestations of the latent variable).
Measuring Latent Variables • Let’s answer the following question: Someone who is distressed should be likely to do the following things: __________. • These things—which also need to be operationally defined—can be considered observable indicators of the unobserved state of stress.
Measuring Latent Variables • Let’s focus on one potential indicator for the moment: The number of things a person has to do by Friday—a “to do” list. • We could operationalize this in a relatively simple way by asking people “How many things do you need to do before Friday?” and recording the response. • The answer essentially becomes the person’s score on the latent variable: an equivalence relationship.
For each extra task, we assume the person is more distressed. Someone who has 8 things to do would get a stress score of 8. Number of things to do by Friday Stress
Equivalence Relationship • Advantages: • Explicit and straight-forward • Doesn’t require complicated mathematics • Other researchers can easily determine what you did • Disadvantages: • Behaviors are influenced by many things. Thus, the indicator (e.g., “things to do”) might be a better measure of “being employed” rather than “stress” per se. • Latent variables manifest themselves in a variety of ways. By focusing on one indicator, our measurements are not as rich or compelling.
Multiple indicators • A more ideal situation is to use multiple indicators to assess a latent variable. • Example: Stress
We assume that when someone is experiencing stress (a latent variable), that person is more likely to have an increased heart rate, complain more, and report having more things to do (all of these need to be operationally defined). heart rate complaints To do list stress
Multiple indicators: Caution • When using multiple indicators, there is a temptation to average the observed scores to scale people on the construct • Example: (complaints + heart rate)/2 = stress Person A: (2 + 80)/2 = 82/2 = 41 Person B: (3 + 120)/2 = 123/2 = 62
Multiple linear indicators: Caution • This can lead to several problems if each manifest variable is measured on a different scale. • First, the resulting metric for the latent variable doesn’t make much sense. Person A: 2 complaints + 80 beats per minute = 41 complaints/beats per minute???
Multiple linear indicators: Caution • Second, the variables may have different ranges. • If this is true, then some indicators will “count” more than others.
Multiple linear indicators: Caution • Variables with a large range will influence the latent score more than variable with a small range Person Heart rate Complaints Average A 80 2 41 B 80 3 42 C 120 2 61 D 120 3 62 * Moving between lowest to highest scores matters more for one variable than the other * Heart rate has a greater range than time spent talking and, therefore, influences the total score more (i.e., the score on the latent variable)
Mapping • One solution to this problem is to (a) define a metric for the latent variable and (b) formalize the mapping of the indicator onto the latent variable. • Mapping—specifying the relationship between the latent and manifest/observed variable.
heart beat /10 Complaints stress stress Sleep problems stress In our example we might assume that stress is on an interval metric, with values ranging between -4 and + 4. Note, however, that each observed variable has a different metric (one is heart beats per minute, another is number of complaints). Thus, we need to specify how the measured scores translate into the latent scores.
Allow the lowest measured value to represent the lowest value of the latent variable. 100 Allow the highest measured value to represent the highest value of the latent variable. 80 60 Observed 40 Draw a line between these points to map the relationship between the observed and latent variable. 20 0 0 -4 4 Latent
heart beat / 10 Complaints Things to do Stress Stress Stress Now we can map the observed scores for each measured variable onto the scale for the latent variable. For example, the observed heart rate score of 120 maps onto a stress score of 2. Ten complaints over a week maps onto a stress score of zero. Thirteen things to do maps to a high stress score of 3.
heart beat/10 talking phone calls attraction attraction attraction This mapping process provides us with three estimates of the latent stress score: 2, 0, and 3. Because we are trying to estimate a single number for stress and because these numbers are on the same scale, we can simply average these three estimates to obtain our measurement of attraction. In this example: (2 + 0 + 3)/3 = 5/3 = 1.67 (somewhat stressed)
Multiple indicators • Advantages • By using multiple indicators, the uniqueness of each indicator gets washed out by what is common to all of the indicators. (example: heart rate and running up the stairs) • Disadvantages • More complex to use • There is more than one way to scale the latent variable, thus, unless a scientist is very explicit, you might not know exactly what he or she did to obtain the measurements.
Summary • Recap of what we did • Identified two (or more) indicators of the latent variable and operationally defined those. • Determined the metric of the latent variable • Mapped the relationship between the latent variable and each observed variable • Using this mapping, we calculated the latent scores for each person with each observed variable. • Averaged the latent score estimates for each person to get a single estimate of where that person falls on the latent variable. • This is often called a “composite score” and is used as an estimate of the person’s standing on the latent variable of interest.