Download
1 / 24
280 likes | 488 Views
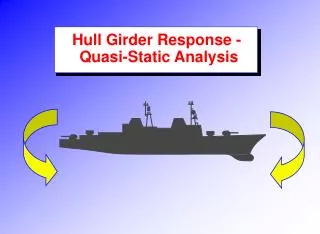
Hull Girder Response - Quasi-Static Analysis. Basic Relationships. Model the hull as a Free-Free box beam. Beam on an elastic foundation Must maintain overall Static Equilibrium. Force of Buoyancy = Weight of the Ship LCB must be in line with the LCG. Basic Relationships.

E N D
Basic Relationships • Model the hull as a Free-Free box beam. • Beam on an elastic foundation • Must maintain overall Static Equilibrium. • Force of Buoyancy = Weight of the Ship • LCB must be in line with the LCG
Basic Relationships • From Beam Theory – governing equation for bending moment: • Beam is experiencing bending due to the differences between the Weight and Buoyancy distributions Where f(x) is a distributed vertical load. Net Load Buoyancyrga(x) Weightgm(x)
Basic Relationships buoyancy curve - b(x) weight curve - w(x) net load curve - f(x) = b(x) - w(x) Sign Convention Positive Upwards + f
Basic Relationships • The solution for M(x) requires two integrations: • The first integration yields the transverse shear force distribution, Q(x) • Impose static equilibrium on a differential element f M Q Q + dQ M + dM dx But ships are “Free-Free” Beams - No shear at ends!Q(0) = 0 and Q(L) = 0, so C = 0
Finding Shear Distribution Net Load -f Sign Convention Positive Upwards + f : Shear Force - Q + Q Positive Clockwise + Q : - Q
Basic Relationships • The second integration yields the longitudinal bending moment distribution, M(x): • Sum of the moments about the right hand side = 0 0 f M Q Q + dQ M + dM dx Again, ships are “Free-Free” Beams - No moment at ends!M(0) = 0 and M(L) = 0, so D = 0
Finding Bending Moment Distribution Shear Force - Q Sign Convention + Q Positive Clockwise + Q : - Q Bending Moment - M Positive Sagging + M : - M
Shear & Moment Curve Characteristics • Zero shear and bending moments at the ends. • Points of zero net load correspond to points of minimum or maximum shear. • Points of zero shear correspond to points of minimum or maximum bending moment. • Points of minimum or maximum shear correspond to inflection points on bending moment curve. • On ships, there is no shear or bending moments at the forward or aft ends.
Still Water Condition • Static Analysis - No Waves Present • Most Warships tend to Sag in this Condition Putting Deck in Compression Putting Bottom in Tension
Quasi-Static Analysis • Simplified way to treat dynamic effect of waves on hull girder bending • Attempts to choose two “worst case”conditions and analyze them. • Hogging Wave Condition • Wave with crest at bow, trough at midships, crest at stern. • Sagging Wave Condition • Wave with a trough at bow, crest at midships, trough at stern. • Wave height chosen to represent a “reasonable extreme” • Typically: • Ship is “balanced” on the wave and a static analysis is done.
Wave Elevation Profiles • The wave usually chosen for this analysis is a Trochoidal wave. It has a steeper crest and flatter trough. • Chosen because it gives a better representation of an actual sea wave than a sinusoidal wave. • Some use a cnoidal wave for shallow water as it has even steeper crests.
Sagging Wave Excess Weight Amidships - Excess Buoyancy on the Ends Compression Tension
Hogging Wave Excess Buoyancy Amidships - Excess Weight on the Ends Tension Compression
Weight Curve Generation • The weight curve can be generated by numerous methods: • Distinct Items (same method as for LCG) • Parabolic approximation • Trapezoidal approximation • Biles Method (similar to trapezoidal) • They all give similar results for shear and bending moment calculations. Select based on the easiest in your situation.
Distinct Item Method Each component is located by its l, t and v position and weight Can be misleading for long components
Weight Item Information • For each weight item, need W, lcg, fwd and aft W fwd lcg aft FP
Trapezoid Method • Models weight item as a trapezoid • Best used for semi-concentrated weight items • Need the following information: • Item weight – W (or mass, M) • Location of weight centroid wrt FP - lcg • Forward boundary wrt FP - fwd • Aft boundary wrt FP - aft • lcg must be in middle 1/3 of trapezoid
Trapezoid Method • Find l and x • Solve for wfand wa so trapezoid’s area equals W and the centroid is at the lcg FP lcg x wa G wf fwd l/2 l aft
Biles Method • Used for weight items which are nearly continuous over the length of the ship. • Assumes that weight decreases near bow & stern. • Assumes that there is a significant amount of parallel middle body. • Models the material with two trapezoids and a rectangle.
Biles Method lcg x G 1.2h wa wf aft FP