Download
1 / 21
210 likes | 243 Views
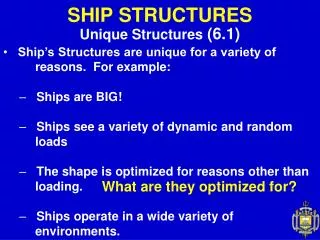
Understand and apply beam theory principles through shear and moment diagrams. Learn how load, shear, bending, and deflection relate in structural analysis.

E N D
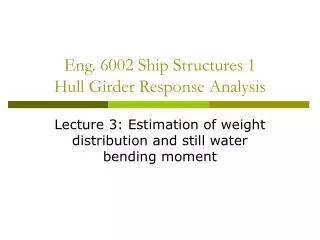
Eng. 6002 Ship Structures 1Hull Girder Response Analysis Lecture 7: Review of Beam Theory
Overview • In this lecture we will review the elastic response of beams and the relationship between load, shear, bending, and deflection. • We will use the following sign conventions:
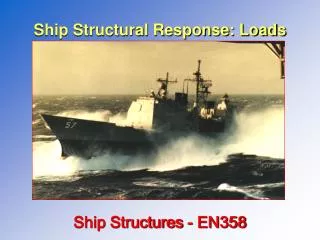
Static Equilibrium Equations • We look at a small section of the beam as a free body in equilibrium. For any static equilibrium problem, all forces and moments in all directions must be equal to zero • Summing vertical forces we have
Static Equilibrium Equations • This means that a line load on a beam is equal to the rate of change of shear • Now, summing moments
Static Equilibrium Equations • This means that shear load in a beam is equal to the rate of change of bending moment • We can write these equations in integral form • In words – shear is the sum of all loads from start to x
Shear and Moment Diagrams example • A beam is loaded and supported as shown Draw complete shear force and bending moment diagrams. • Determine the equations for the shear force and the bending moment as functions of x. Source: http://www.public.iastate.edu
Shear and Moment Diagrams example • We start by drawing a free-body diagram of the beam and determining the support reactions. • Summing moments about the left end of the beam • Summing vertical forces Source: http://www.public.iastate.edu
Shear and Moment Diagrams example • Sometimes knowing the maximum and minimum values of the shear and bending moment are enough • So we will determine shear force diagrams by inspection Source: http://www.public.iastate.edu
Shear and Moment Diagrams example • The 30-kN support reaction at the left end of the beam causes the shear force graph to jump up 30 kN (from 0 kN to 30 kN). Source: http://www.public.iastate.edu
Shear and Moment Diagrams example • The distributed load causes the shear force graph to slope downward. Since the distributed load is constant, the slope of the shear force graph is constant (dV/dx = w = constant). • The total change in the shear force graph between points A and B is 40 kN (equal to the area under the distributed load between points A and B) from +30 kN to -10 kN. Source: http://www.public.iastate.edu
Shear and Moment Diagrams example • Where does the shear force becomes zero? • How much of the distributed load will it take to cause a change of 30 kN (from +30 kN to 0 kN)? Since the distributed load is uniform, the area (change in shear force) is just 10 × b = 30, which gives b = 3 m. • The shear force graph becomes zero at x = 3 m (3 m from the beginning of the uniform distributed load). Source: http://www.public.iastate.edu
Shear and Moment Diagrams example • The 16-kN force at B causes the shear force graph to drop by 16 kN (from -10 kN to -26 kN). Source: http://www.public.iastate.edu
Shear and Moment Diagrams example • Since there are no loads between points B and C, the shear force graph is constant (the slope dV/dx = w = 0) at -26 kN. Source: http://www.public.iastate.edu
Shear and Moment Diagrams example • Since there are no loads between points B and C, the shear force graph is constant (the slope dV/dx = w = 0) at -26 kN. Source: http://www.public.iastate.edu
Shear and Moment Diagrams example • The 45-kN force at C causes the shear force graph to jump up by 45 kN, from -26 kN to +19 kN. Source: http://www.public.iastate.edu
Shear and Moment Diagrams example • There are no loads between points C and D, the shear force graph is constant (the slope dV/dx = w = 0) at +19 kN. Source: http://www.public.iastate.edu
Shear and Moment Diagrams example • Now we look at the moment diagram • Note that since there are no concentrated moments acting on the beam, the bending moment diagram will be continuous (i.e. no jumps)
Shear and Moment Diagrams example • The bending moment graph starts out at zero and with a large positive slope (since the shear force starts out with a large positive value and dM/dx = V ). • As the shear force decreases, so does the slope of the bending moment graph. At x = 3 m the shear force becomes zero and the bending moment is at a local maximum (dM/dx = V = 0 ) • For values of x greater than 3 m (3 < x < 4 m) the shear force is negative and the bending moment decreases (dM/dx = V < 0). Source: http://www.public.iastate.edu
Shear and Moment Diagrams example • The shear force graph is linear so the bending moment graph is a parabola. • The change in the bending moment between x = 0 m and x = 3 m is equal to the area under the shear graph between those two points. • So the value of the bending moment at x = 3 m is M = 0 + 45 = 45 kN·m. • The change in the bending moment between x = 3 and x = 4 m is also equal to the area under the shear graph • So the value of the bending moment at x = 4 m is M = 45 - 5 = 40 kN·m. Source: http://www.public.iastate.edu
Shear and Moment Diagrams example • The bending moment graph is continuous at x = 4 m, but the jump in the shear force at x = 4 m causes the slope of the bending moment to change suddenly from dM/dx = V = -10 kN·m/m to dM/dx = -26 kN·m/m. • Since the shear force graph is constant between x = 4 m and x = 7 m, the bending moment graph has a constant slope between x = 4 m and x = 7 m (dM/dx = V = -26 kN·m/m). • The change in the bending moment between x = 4 m and x = 7 m is equal to the area under the shear graph between those two points. • The area of the rectangle is just -26 × 3= -78 kN·m. So the value of the bending moment at x = 7 m is M = 40 - 78 = -38 kN·m. Source: http://www.public.iastate.edu
Shear and Moment Diagrams example • Again the bending moment graph is continuous at x = 7 m. The jump in the shear force at x = 7 m causes the slope of the bending moment to change suddenly from dM/dx = V = -26 kN·m/m to dM/dx = +19 kN·m/m. • Since the shear force graph is constant between x = 7 m and x = 9 m, the bending moment graph has a constant slope between x = 7 m and x = 9 m (dM/dx = V = +19 kN·m/m). • The change in the bending moment between x = 7 m and x = 9 m is equal to the area under the shear graph between those two points. The area of the rectangle is just M = (+19 × 2) = +38 kN·m. So the value of the bending moment at x = 7 m is M = -38 + 38 = 0 kN·m. Source: http://www.public.iastate.edu