Download

1 / 1
10 likes | 112 Views
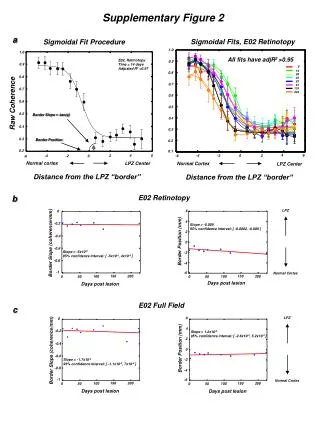
This figure illustrates the association between miR-200c expression levels and disease-free survival (DFS) probabilities in patients with Stages II and III cancers. Patients with low miR-200c levels (n=29) showed a statistically significant DFS probability compared to those with high levels (n=30), with a P-value of 0.025. Time after operation (in months) was also analyzed, revealing varying DFS probabilities at different intervals. These findings suggest miR-200c could serve as a potential biomarker for patient prognosis.

E N D
Supplementary Figure 2 100 Low miR-200c (n=29) 80 A: Stage II B: Stage III High miR-200c (n=30) 60 DFS probability (%) 100 40 80 Low miR-200c (n=16) 20 P = 0.025 60 0 DFS probability (%) 0 20 40 60 80 100 40 High miR-200c (n=23) Time after operation (months) 20 P = 0.11 0 0 20 40 60 80 100 Time after operation (months)