Download
1 / 17
180 likes | 311 Views
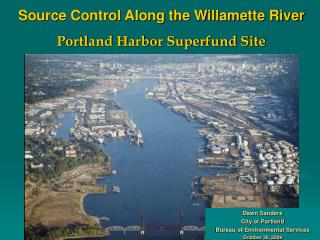
Columbia River Overview Superfund Process Conceptual Site Models Data Gap Analysis. Columbia River Surface Water Hydrology Plays a Critical Role in Sedimentation. Flow rates High flows within the Hanford section results in minimum sedimentation Major river confluences Yakima Snake

E N D
Columbia River Overview • Superfund Process • Conceptual Site Models • Data Gap Analysis
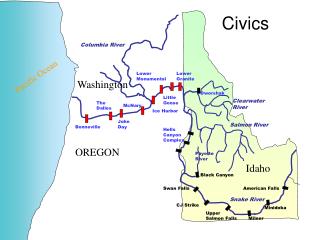
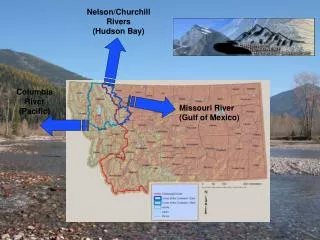
Columbia River Surface Water Hydrology Plays a Critical Role in Sedimentation • Flow rates • High flows within the Hanford section results in minimum sedimentation • Major river confluences • Yakima • Snake • Walla Walla
S S S S S S S S S S S The Majority of the Hanford Reach is a Non-Depositional Area
S S S S S S S S S S S The Majority of the Hanford Reach is a Non-Depositional Area
1188 2366 568 USGS Annual Statistics Estimated Suspended Sediment Load (tons/day) Average Flow (cfs) Suspended Load (Kg/m3) River Columbia (Priest Rapids Dam) 117,480 0.00375 Snake 54,830 0.016 Yakima 3,512 0.06
Columbia Snake Flow average 117,480 cfs (1188 tons/day) Yakima Walla Walla
Columbia Snake Yakima Flow average 54,830 cfs (2,366 tons/day) Walla Walla
Columbia Snake Yakima Walla Walla Flow average 13,512 cfs (568 tons/day)
Columbia Snake Yakima Walla Walla Flow average 568 cfs
90 ft Water McNary Dam currently has approximately 30ft of sediment • Average Annual Deposit Rate is 2 to 7 in/yr } 2000 Est. 30 ft Sediment 1990 1980 1970 1960 1950
Conceptual Exposure Model What is a CEM? • Sources • Migration pathways • Receptors • Exposures
Sources of Contaminants to the River • Upriver Sources • Hanford Reach Sources • Downriver Sources
Generic Hanford Conceptual Site Model Historic cooling water discharge Reactors/ Operational Areas GW seeps
Conceptual Site Model – Cross Section Receptors Source Cooling water Cross section illustrates: • Sources • Migration pathways • Receptors: people, benthic, fish, etc. • Potential Exposure Points Columbia River
Site Conceptual Model – Recreational Islands Source Receptors Cooling water Columbia River Columbia River
Conceptual Site Model – Richland Area Industrial discharge Water Intake Structure Industry House Irrigation discharge Agriculture Beach Columbia River Water supply Water supply
Green line Hanford Site 100/300 Study Area and Inter-Area CRC Study Area Study Area Cross-Section West East Columbia River