Download
1 / 23
230 likes | 365 Views
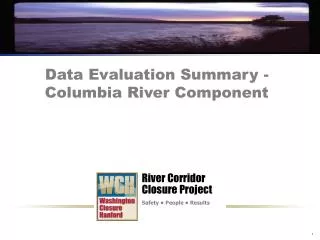
Data Evaluation Summary - Columbia River Component. River Corridor Closure Project. Safety • People • Results. Data Compilation Summary. Data Compilation began in December 2004

E N D
Data Evaluation Summary -Columbia River Component River CorridorClosure Project Safety • People • Results
Data Compilation Summary • Data Compilation began in December 2004 • A series of 10 Workshops held over a 10 month period to develop, guide, and update the data compilation task (December 2004 to September 2005) • Data compiled and evaluated by 5 independent subcontractors including 3 universities (WSU, UW, OSU) • Effort summarized in Existing Source Information Summary Report, WCH-64, Rev. 0 (January 2006)
Data Source Summary Focus of the data evaluation effort was on sediment and surface water samples (abiotic) Methodology similar to other regional studies • Total of 1,448 source documents entered into CRC database • Sediment - 72 QA1, 16 QA2, and 16 QA3 sources • Surface Water – 49 QA1 and 5 QA2 sources • Biota – 125 sources • QA categories refers to the pedigree of the quality of the data
Data Sample Summary Total of 15,078 samples entered into CRC database Sediment - 1,578 samples Surface Water - 4,857 samples Core Sediment - 37 samples Biota - 8,606 samples
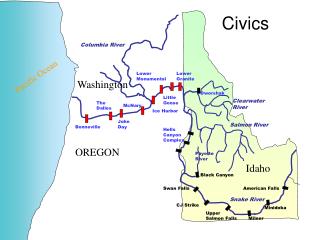
Sediment Samples Segment 1 – majority collected from behind Priest Rapids Dam (121) Segment 2 – good distribution Segment 3 – primarily behind McNary Dam (170); some from behind Ice Harbor Dam (32), and Yakima River (20) Segment 4 – most from behind The Dalles Dam (101); several behind John Day (23) and Bonneville Dams (17) Segment 5 – good distribution
Surface Water Samples Segment 1 – majority collected near Priest Rapids Dam (300) or Vernita Bridge (451) Segment 2 – good distribution; significant number of samples associated with springs Segment 3 – Majority from tributaries (i.e., Yakima, Snake, and Walla Walla rivers); only 18 from near McNary Dam Segment 4 – most near The Dalles (71) and Bonneville (30) dams; some near Umatilla (11) Segment 5 – decent distribution; 133 collected at Beaver Army Terminal (RM 53.8), and several from tributaries and sloughs
Methodology for Historical Data Evaluation • Reviewed of bibliographic source information to verify accuracy • Confirmed correct QA category was assigned by reviewing of QA and QC information • Standardized all data entered into the database including: • Regional datums (i.e. northings and eastings) • Concentrations (mg/kg or pCi/g for solids; mg/L or pCi/L for liquids) • Decayed radionuclide results through 2005 (sediment samples only)
Benchmark Values • Benchmark values selected to evaluate the protection of human and ecological receptors • When more than one benchmark value was available for a medium and receptor, the lowest benchmark value was selected • Sediment samples were also compared to background soil concentrations as no sediment background values are available • If the benchmark value for sediments was lower than the soil background values, the benchmark defaulted to the background value
Sediment HH Benchmark Values benchmarks have not yet been developed for the protection of human health from potential direct contact exposure to surface sediment, therefore the following sources were used Nonradiological Human Health Benchmarks • WAC-173-340-740 cleanup levels for unrestricted land use • EPA Region IX Preliminary Remediation Goals (residential) Radiological Human Health Benchmarks • cleanup levels developed in the Remedial Design Report/Remedial Action Work Plan for the 100 Area (DOE/RL-96-17)
Sediment Ecological Benchmark Values no specific statewide standards for freshwater sediment quality available [WAC 173-204-340]; for completeness used the marine sediment quality standards Nonradiological Ecological Benchmarks -Consensus-Based Sediment Quality Guidelines (McDonald 2000) -Creation and Analysis of Freshwater Sediment Quality Values in Washington State (Ecology 1997) -Guidance for Ecological Risk Assessment Level II Screening Level Values (ODEQ 2001) Radiological Ecological Benchmarks -the Biota Concentration Guides, derived using the RESRAD Biota Version 1.0
Surface Water HH Benchmark Values Nonradiological Benchmarks • EPA’s National Recommended Water Quality Criteria including the protection of human health for the consumption of water and organism, and the consumption of the organism only (EPA 2006) Radiological Benchmarks • The drinking water MCLs derived for radiological contaminants were selected as a surrogate because surface water values have not been developed to evaluate direct exposure
Surface Water Ecological Benchmark Values Nonradiological Benchmarks • Washington Chronic Water Quality standards (Ecology 2003) • Oregon Aquatic Biota Screening Values (ODEQ 2001) • National Ambient Water Quality Standards (EPA 2002) Radiological Benchmarks • Water concentration guidelines, derived using the RESRAD Biota Version 1.0
Summary of Sediment Results Data evaluated included all QA1, QA2, and some QA3 samples. Samples primarily from 1976 to current • Primary metals exceeding benchmarks – arsenic, cadmium, and chromium; arsenic and cadmium likely tied to upstream source • Primary radionuclides exceeding benchmarks – Thorium-232, Uranium-234, Uranium-238 • PCB Aroclors exceeded ecological benchmarks in most segments • Pesticides exceedences primarily associated with tributaries • PAHs exceeded ecological benchmarks primarily in Segment 5
Summary of Surface Water Results Data evaluated primarily included QA1 and some QA2 samples from 1999 to current ( representative of current conditions) • Most exceedences for ecological benchmarks • Metals exceeding benchmarks – aluminum, arsenic, barium, cadmium, chromium, iron, lead,manganese, silver and zinc; some analyses limited to Segments 1 and 2 • Radionuclides exceeding benchmarks – Strontium-90 and tritium, analyses limited to Segments 1 and 2 • Pesticides exceedences include DDE, DDT, dieldrin, and heptachlor epoxide; majority associated with tributaries; not analyzed in Segment 2 and limited in Segment 4
Core Sediment Sample Summary • Core data collected at known depositional areas and used to determine concentrations deposited at set points in time • Core data primarily associated with a six radionuclides (i.e., cobalt-60, cesium-137) • Core data decayed to 2005 activity levels for radionuclides • Data primarily from the Association of Hanford Origin Radionuclides with Columbia River Sediments (BNWL-2305) report; however supplemented with more recent data where available
Data from 1976 sediment cores Data collected from surface sediment sampling Increased Cs-137 from other sources No data collected Core Sediment – McNary Dam Data is from sediment cores taken in 1976 and supplemented with surface sediment samples taken in during recent years. There is no data from the late 1970s and 1980s.
Core Sediment – All Dams Dates of deposition correspond with the depth. The red bars represent the points that were used to show the comparison between each dam.
Data Gaps • Limited recent radiological data in downstream Segments 4 and 5; most programs discontinued because short-lived radionuclides were no longer present • Limited sets of analytes because studies were focused on specific needs • Limited sediment sampling for Segments 4 • Limited PCB, PAH, pesticide, and SVOC data for Segment 2
Conclusion selected benchmark values are the most protective values available; concentrations above benchmark values indicates a potential adverse effect to receptors Sediment • Metals such as arsenic and cadmium measured throughout river and likely tied to upstream source; chromium noticeably higher in Segments 1 and 2 • Radionuclides such as uranium-234 and uranium-238 are near or slightly above background for all segments except near 300 Area • Limited core data and recent data indicates current concentrations behind dams are at or near Hanford Site background levels
Conclusion(continued) Surface Water • Exceedences primarily associated with ecological benchmarks • Majority of exceedences (i.e., chromium, strontium-90, tritium) tied to seeps located along the Columbia River within the Hanford Site