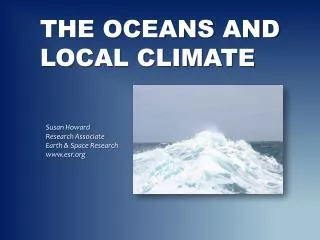
OCEANS MODERATE CLIMATE
OCEANS MODERATE CLIMATE. Morgen Kelm. WHAT IS CLIMATE?. Climate is the average weather usually taken over a 30-year time period for a particular region and time period.

OCEANS MODERATE CLIMATE
E N D
Presentation Transcript
OCEANS MODERATE CLIMATE Morgen Kelm
WHAT IS CLIMATE? • Climate is the average weather usually taken over a 30-year time period for a particular region and time period. • Climate is not the same as weather, but rather, it is the average pattern of weather for a particular region. Weather describes the short-term state of the atmosphere. • Two of the most important factors determining an area's climate are air temperature and precipitation. • Other factors include humidity, atmospheric pressure and wind. http://www.blueplanetbiomes.org/climate.htm http://www.weatherwizkids.com/weather-climate.htm
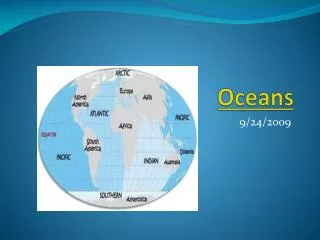
THE CLIMATE OF A LOCATION IS AFFECTED BY: • latitude (distance from Equator) • terrain • altitude • ice or snow cover • nearby water bodies and their currents. http://en.wikipedia.org/wiki/Climate
CLIMATE IS AFFECTED BY NEARBY WATER BODIES AND THEIR CURRENTS • Oceans cover about 70 percent of Earth's surface. Their large size and immense heat capacity allow them to absorb and store a large amount of the sun’s energy in the form of heat. • The movement of ocean currents transport the stored heat around the globe, which helps to regulate climates worldwide. • The ocean can warm or cool the air. • When the air is at a lower temperature than seawater, the ocean transfers heat to the lower atmosphere. • When the air is at a higher temperature than seawater, the ocean absorbs heat from the lower atmosphere. • In this way, the ocean's circulation compensates somewhat for the sun's unequal heating of the Earth. http://sciguides.nsta.org/guides/guide_preview.aspx?guide_ID=!plus!ORf5xO54K4=&grade_band=3 http://www.sciencebyjones.com/specific_heat1.htm
COASTAL VS. INLAND CLIMATES • The ocean acts as an insulator, resulting in coastal areas having generally milder climates than regions that are further from the ocean or “inland.” • Coastal areas are cooler and wetter than inland areas. Clouds form when warm air from inland areas meets cool air from the sea. • Inland climates are subject to more extreme temperature (hot summers and colder winters) due to their distance from the stabilizing effects of oceans. http://seawifs.gsfc.nasa.gov/OCEAN_PLANET/HTML/oceanography_currents_4.html http://www.ecn.ac.uk/Education/factors_affecting_climate.htm
COASTAL VS. INLAND CLIMATES http://www.lightrailnow.org/images02/usa-map-major-cities-rev_Enchanted-Learning.jpg
COASTAL VS. INLAND CLIMATES • Coastal Climate: San Francisco, CA • July Average High Temperature: 68.2°F • January Average High Temperature: 58.1°F • Average Temperature Change: 10.1°F • Inland Climate: Denver, CO • July Average High Temperature: 88.0°F • January Average High Temperature: 43.2°F • Average Temperature Change: 44.8°F http://www.rssweather.com/climate
WHAT ABOUT OREGON’S CLIMATE? • What is Portland’s climate? • Will the climate vary in different areas of Oregon? • Which region will have the mildest climate? • Which region will have most extreme climate?
Each student will need to collect an Oregon map, a temperature data sheet, a poster board w/ push pins, scissors, glue, and colored pencils. (Glue and colored pencils can be shared by table.) Label and color the Pacific Ocean on your Oregon map. Cut out the Oregon map, making sure not to cut off the Pacific Ocean! Glue your map to the poster board provided. Calculate the difference in “high” temperatures for January and July for each of the cities provided on the data sheet. Now locate each of the cities on your Oregon map and use a push pin of the representative climate color (indicated on the data sheet) to mark each city. PLEASE BE CAREFUL WITH THE PUSH PINS, THEY ARE SHARP!!! Finally, use the colored pencils to estimate the climates in full regions of your Oregon map. You should use your colored push pins to guide you. The mildest climate areas blue, the average climate areas green, and the most extreme climate areas orange. Your whole map should be colored in when you are finished. When you are done please put away all supplies and recycle scrap paper. ACTIVITY
DOES YOUR MAP LOOK LIKE THIS? http://www.ocs.orst.edu/page_links/climate_data_zones/or_climate.gif