Download
1 / 13
130 likes | 244 Views
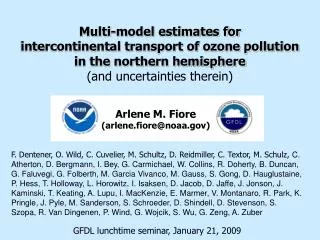
Modeling Intercontinental Transport, Hemispheric Pollution, And Climate Linkages At GFDL. Arlene M. Fiore Larry W. Horowitz. NOAA/EPA Scientist-to-Scientist Meeting Boulder, CO October 28, 2004.

E N D
Modeling Intercontinental Transport, Hemispheric Pollution, And Climate Linkages At GFDL Arlene M. Fiore Larry W. Horowitz NOAA/EPA Scientist-to-Scientist Meeting Boulder, CO October 28, 2004
Air quality-Climate Linkage:CH4, O3 are important greenhouse gasesCH4 contributes to background O3in surface air O3 greenhouse gas Free Troposphere hn Global Background O3 (Hemispheric Pollution) NO NO2 OH HO2 Boundary layer (0-3 km) Direct Intercontinental Transport VOC,CH4, CO air pollution (smog) NOx NMVOCs O3 NOx NMVOCs O3 air pollution (smog) CONTINENT 1 CONTINENT 2 OCEAN
Trans-Pacific Transport (ITCT 2K2) CO (ppbv), 500hPa, April 28 – May 5, 2002
Trans-Pacific Transport (ITCT 2K2) May 05 Flight
May 05 Flight, CO (ppbv) Direct intercontinental transport of CO leads to observed enhancements in total concentrations
Episodic O3 enhancements not usually detected hemispheric background influence Asian O3 (ppbv) at surface in MOZART-2April-May 2002 Mean
Methane emissions enhance global O3 background Decrease in MOZART-2 July 1995 Mean Surface O3 concentrations from 50% reductions in global anthropogenic CH4 emissions ppbv Results consistent with earlier GEOS-CHEM results
Air Quality-Climate Linkage: Impacts of future changes in global anthropogenic emissions (GEOS-CHEM; 4°x5°) Number of U.S. summer grid-square days with O3 > 80 ppbv Radiative Forcing* (W m-2) 50% anth. CH4 50% anth. NOx 50% anth. VOC 2030 A1 2030 B1 1995 (base) 50% anth. VOC 50% anth. CH4 50% anth. NOx 2030 A1 2030 B1 CH4 links air quality & climate via background O3 Fiore et al., GRL, 2002
Methane emission reductions shift entire summertime afternoon surface O3 frequency distribution over U.S.(GEOS-CHEM results) Probability ppbv-1 Ozone Concentration (ppbv)
Near-term MOZART-2 simulations for addressing hemispheric pollution(NCEP T62 ~1.9° resolution) • Sensitivity simulations with various combinations of global/national/sector reductions in CH4 emissions • Global & regional climate forcings • Characterize ozone response - methane emissions relationship • Contribute to IPCC AR4 atmospheric chemistry section • 2030: IIASA scenarios (2000 base, BAU, MFR) & SRES A2 • 2100: IPCC scenarios • AEROCOM (present-day) • Historical 1860-1990 (decadal)