Download
1 / 27
280 likes | 386 Views
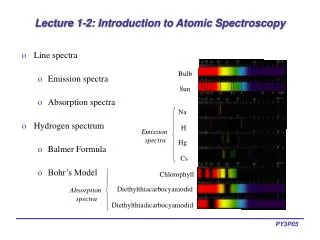
Explore the dimensions of color theory, electromagnetic spectrum, and radiance data in remote sensing to understand color simulation and creation through selective absorption methods. Gain insights on solid angles and human color perception. Learn about additive color mixing and various color data spaces.

E N D
Thursday, 14 January Lecture 4: The spectrum, color theory and absorptionand photogrammetry Reading Ch 2.3 http://www.bway.net/~jscruggs/film.html (color film) 1
Previous lecture: Spatial data - photointerpretation & basic color theory • What we covered: • Image geometry • Color vs. B/W, shape and composition • Interpretation of some images 2
Color Color is a sensation that can be predicted and controlled Color has 3 dimensions and can be simulated by radiances at three different l’s In natural color those are red, green and blue but In remote sensing any 3 may be combined as a “false-color” image Therefore we need to understand color Color is created by selective absorption, so we need to understand that first 3
The electromagnetic spectrum Light is energy - Q =hnin ergsor joules (J)where h = Planck’s constant, 6.63·10-34 J s n = frequency (s-1) = c/l (c = speed of light, 3.00x10⁸ ms-1, l = wavelength (µm,nm,mm,cm,m) For SI units frequently used in Remote Sensing, see back cover of text In remote sensing we commonly measure the flux of photons from a unit surface for a certain amount of time and by a camera or scanner a certain distance away with a lens of a particular diameter This flux is called the radianceL and the units are W m-2 sr-1. WattsW (power) are energy per unit time (J s-1) Sr stands for steradian and is the solid angle subtended by the pixel 4
Review On Solid Angles, class website (Ancillary folder: Steradian.ppt) On solid angles… On a plane, we can measure the angle q between 2 vectors sharing endpoint P, the center of a circle of radius r. A radian is defined as the angle that subtends an arc on a circle equal to the radius. It is about 57 degrees (360/2p). A circle is divided into 360 degrees, or 2p radians. In a volume, we can measure solid angles as shown to the right, where P is the center of a sphere of radius r and q is the solid angle of a cone that intersects the sphere in a small circle of circumference p*C. A sphere (area = 4pr2) contains 4p steradians, where a steradian (sr) is the unit of solid angle. The cone defined to the right subtends a solid angle of 1 sr.
Let’s start with how humans sense color: Cone-shaped cells within the eye absorb light in 3 wavelength ranges – RGB They send signals to the brain proportional to how much light is absorbed The brain turns these signals into the sensation of color Color has three attributes – hue, saturation, and intensity or lightness color (perception) is related to radiance (physical flux) Section of the eye 5
DAY Bright light NIGHT Dim light Rods are more sensitive than cones In bright light, the three sets of cones send strong signals to the brain that drown out the signal from the rods. The signals are interpreted as the sensation of color In dim light, the signal from the single set of rods is dominant. It is interpreted as the sensation of black/white (gray) 1 nanometer (nm) = 10-9 m = 10-3mm 6
Red Red Green Green Blue Blue The spectrum and color Spectral yellow Gray brightness Wavelength, l (mm) Red Green Blue Cartoon spectrum – A useful tool 8
Red Red Red Red Green Green Green Green Blue Blue Blue Blue = Additive Color + 9
Additive mixtures – another framework 0, 100, 0% g 50, 50, 0% 33, 33, 33% r b 0, 0, 100% 100, 0, 0% 10
A D D I T I V E M I X I N G 11
To work with color, we use three different data “spaces”: *Perceptual data space – how we sense color intuitively (Hue, saturation, intensity) *Radiance data space – how the color stimulus is described by the measured image data *Transformed DN space – a mathematical description of color that is related to radiance 12
A simple perceptual color space (HSI) HUE SATURATION INTENSITY (LIGHTNESS) 13
2) RGB radiance space r=R/(R+G+B) g=G/(R+G+B) b=B/(R+G+B) B b G g 0 r R 14
3) Transformed data space r=R/(R+G+B) g=G/(R+G+B) b=B/(R+G+B) The CIE system: characterizes colors by a brightness parameter Y plus two color coordinates x and y. The response of the eye is best described in terms of three tristimulus coordinatesrgb. Colors that can be matched by combining a set of three primary colors (ie, Red, Green, Blue) are represented on the chromaticity diagram by a triangle joining the coordinates for the three colors. Any H,S pair can be expressed in terms of the CIE color coordinates x and y, but intensity is not represented. g y r b x 15
g Additive mixtures r b 16
Transformation from a Cartesian XYZ radiance space to a spherical color space Longitude = hue (H) Co-latitude = saturation (S) Radius = intensity (I) XYZ may be any three tristimulus fluxes but are treated as RGB Z Y 0 X 17
Natural color Intensity Transformed Viking Lander RGB images of Mars SAT HUE INT 18
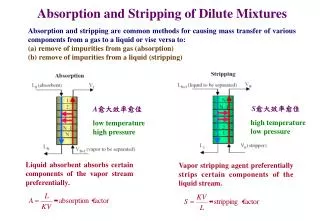
Color is created by selective Absorption Bouguer If L is the radiance from a source at strength Loafter passage through an absorbing medium such as the atmosphere, then: L = e-kz LoW m-2 sr-1 (Beer-Lambert-Bouguer Law) Light must either be reflected, absorbed, or transmitted This is the “rat” law of conservation: L= Lr + La + Lt e-kz describes the % of light transmitted through the medium (assuming Lr =0) k is a value characteristic of the absorptivity of the medium z is the length of passage through the medium (which we take to be homogeneous) 19
Fraction of light transmitted Thickness, mm Absorption by a homogeneous medium is a constant-rate process – for every mm of material the light passes through, a certain fraction is absorbed. If it goes through z mm of medium, the total light remaining is e-kz %, where 1/k is the scale depth – that is, for every 1/k passage through the medium, 1/e = 1/2.718 % = 36.8% of the light remains. Graph of absorption as a function of medium thickness 20
Absorption and color • k is commonly different from wavelength to wavelength (kl) • eg, more light might be absorbed in green than in red or blue • When we see light having passed through such a filter, it appears magenta to us (ie,no green). • We need to consider remote-sensing fluxes to be functions of wavelength • Thus, radiance L (W m-1 sr-1) becomes spectral radiance Ll (W m-1 sr-1 µm-1) 21
A word about filters… Filters Transmittance l, mm Filter functions 22
Red Red Red Green Green Green Blue Blue Blue “Subtractive” Color Red-transmitting filter Input spectrum 100% 1% 1% * Filtered spectrum = Filter Scene 24
Remember: “subtractive” mixing is physically done by multiplication white light green light dark green light green filter yellow filter R: 1.0 * 0.0 = 0.0; * 0.8 = 0.0 G: 1.0 * 0.9 = 0.9; * 0.8 = 0.7 B : 1.0 * 0.0 = 0.0; * 0.0 = 0.0 25
Next lecture: Radiative transfer & sourceswe will trace radiation from its source to camera 26