Deep learning estimation of tropical cyclone intensity from microwave satellite imagery
Deep learning estimation of tropical cyclone intensity from microwave satellite imagery. Anthony Wimmers, Chris Velden Cooperative Institute for Meteorological Satellite Studies University of Wisconsin - Madison. Josh Cossuth U. S. Naval Research Laboratory Washington, DC.

Deep learning estimation of tropical cyclone intensity from microwave satellite imagery
E N D
Presentation Transcript
Deep learning estimation of tropical cyclone intensity from microwave satellite imagery Anthony Wimmers, Chris Velden Cooperative Institute for Meteorological Satellite Studies University of Wisconsin - Madison Josh Cossuth U. S. Naval Research Laboratory Washington, DC
Why should you care? • This deals with: Selecting the right problem to solve, • Using probabilistic inputs, • Avoiding the regression-to-mean problem (partially), • Producing uncertainty with a numerical output, • Validating on two tiers of truth data, • Making conclusions that scientists and forecasters care about.
How do TC forecasters estimate intensity today (when limited to satellite)? “The Dvorak Technique”
How do TC forecasters estimate intensity today (when limited to satellite)? “The Dvorak Technique”
How do TC forecasters estimate intensity today (when limited to satellite)? “The Dvorak Technique” • Also, more recently: • Warm core anomaly • Advanced Dvorak Technique (automated, IR differences) • Deviation Angle Variance Technique • SATCON (composite method) • Other CNNs applied to Geo IR
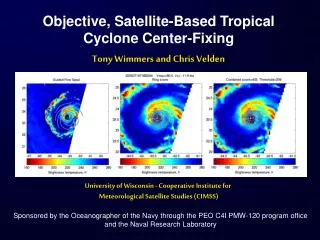
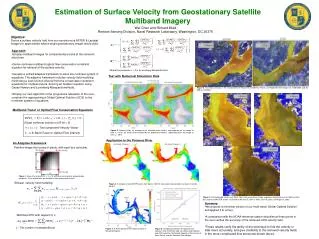
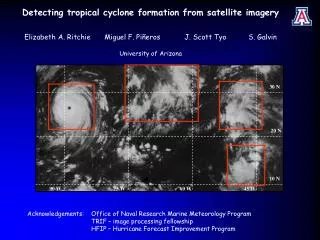
How do TC forecasters estimate intensity today (when limited to satellite)? But what about high-resolution microwave?
How do TC forecasters estimate intensity today (when limited to satellite)? But what about high-resolution microwave? 8/18 0750 UTC 8/19 1539 UTC 8/18 2053 UTC 8/19 2305 UTC 39 hr eyewall evolution of Typhoon Nuri (2008)
Experiment design: • Train/validate/test a Convolutional Neural Network to estimate TC intensity (Maximum Sustained Winds – MSW) from 37 & 89 GHz microwave imagery • Global image dataset (all basins), 1987-2012: 52,753 images (those are limited to: over water, >65% coverage by satellite scan) • Satellites/Sensors: DMSP SSMI/S, TRMM TMI, AMSR-E • Labels: ”Best Track” records (National Hurricane Center and Joint Typhoon Warning Center) • Further independent testing withTC intensity values observed by aircraft (the gold standard)
The CNN model: ‘DeepMicroNet’ https://tech.showmax.com/2017/10/convnet-architectures/ Similar to this: 15 Convolutional layers 5 Pooling layers 1 or 2 input layers (37 & 89 GHz) at 64 x 64 px 2 Fully connected layers with 50% dropout
The CNN model: ‘DeepMicroNet’ “probabilistic label”: Model estimate PDF, knots Truth • DeepMicroNet is set up as a classification model, not a regression model • Categories: 25 kt, 30 kt, … 160 kt • * Not one-hot labeling. Instead of […, 0, 0, 1, 0, 0, …], it takes […, 0.10, 0.23, 0.34, 0.23, 0.10, …] because of uncertainty in the Best Track values.
Training • Training process minimizes cross-entropy (“Loss”) • Converges at 20-40 epochs
37 vs. 89 GHz imagery vs. both 37 GHz 89 GHz • Both channels supply relevant information, but 89 GHz is clearly better for estimating intensity
Model performance 37 GHz 89 GHz Typical model underestimate Tropical depression (25-34 kt) Typical model overestimate
Model performance 37 GHz 89 GHz Typical model underestimate Category 1 (65-83 kt) Typical model overestimate
Model performance 37 GHz 89 GHz Typical model underestimate Category 4 (113-135 kt) Typical model overestimate
Model statistics Testing against all Best Track values Testing against all recon-aided values 2. High bias in Cat 3-4 range 3. Low bias in Cat 5 range 1. Low bias in trop depression – trop storm range RMSE = 14.6 kt RMSE = 10.6 kt
How do TC forecasters estimate intensity today (when limited to satellite)? “The Dvorak Technique”
Model statistics Testing against all recon-aided values 2 2. High bias in Cat 3-4 range 3. Low bias in Cat 5 range 1 3 1. Low bias in trop depression – trop storm range Figure 3 from Knaff, J., D. Brown, J. Courtney, G. Gallina, and J. Beven II, 2010: An evaluation of Dvorak technique–based tropical cyclone intensity estimates. Wea. Forecasting, 25, 1362–1379. RMSE = 10.6 kt
Model statistics • This indicates a strong hypothesis that the microwave channels simply have less sensitivity in the Cat 1-2 (and Cat 5) range. • (Not shown): Model uncertainty matches Best Track uncertainty correctly
Model performance: Additional notes • These results are as reliable as the methods used on geo imagery for the last 45 years, require no expert knowledge, and will improve with more development. • Thanks to deep learning, we have a new capability of probabilistic estimation of TC intensity from satellite. • Deep learning also reveals aspects of the data that came as a surprise: • Sensitivity of 37 GHz to Cat 5 intensities? • Potential for “fixing” the Best Track record (subtracting bias)?
Q/A? Mon. Wea. Rev., in press:
Model performance: Summary • When DeepMicroNet tests on the type of data used to train, RMSE = 14.3 kt. When it tests on a more accurate type of data, RMSE = 10.6 kt. • Thus, DeepMicroNet is able to overcome much of the randomerror in the labeling data without help. • But DeepMicroNet retains the same biases as the labeling data (the Best Track). • Thus there is still room for substantial improvement in the model by correcting biases in the labeling data. • Still, RMSE = 10.6 kt is already close to the state of the art for satellite-based intensity estimation (within 1 kt).