Download
1 / 26
260 likes | 424 Views
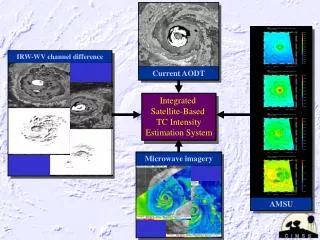
TC Intensity Estimation From Satellite Microwave Sounders. University of Wisconsin - Madison Cooperative Institute for Meteorological Satellite Studies. Jeff Hawkins. Derrick Herndon and Chris Velden. Naval Research Laboratory Monterey, CA.

E N D
TC Intensity Estimation From Satellite Microwave Sounders University of Wisconsin - Madison Cooperative Institute for Meteorological Satellite Studies Jeff Hawkins Derrick Herndon and Chris Velden Naval Research Laboratory Monterey, CA International Workshop on Satellite Analysis of Tropical Cyclones Honolulu, HI 13-16 April 2011 Research sponsors: the Oceanographer of the Navy through the program office at the PEO C4I&Space/PMW-120, under program element PE-0603207N and the Office of Naval Research under program element PE-0602435N
The Advanced Microwave Sounding Unit -- AMSU • Flown aboard NOAA 15-19, METOP and Aqua • 2 Instruments: AMSU-A (temperature), AMSU-B (moisture) • Primary channels of interest are 5-8 on AMSU-A which measure upper-level warm core temperature anomalies that can be directly related to TC intensity Ch 8 ~150 hPa Height (km) Ch 7 ~250 hPa Pressure Ch 6 ~400 hPa Ch 5 ~600 hPa AMSU-A Tb Longitude Result: AMSU-A Tb Anomaly Cross-Section AMSU-A Atmos Contribution Functions
Relationship Between AMSU Tb Anomaly and TC MSLP Channel 8 Tb anomalies (150-200mb) versus collocated and coincident recon MSLP measurements • Sources of Relationship Spread • Hydrometeor scattering (cooling) near TC core • FoV resolution issues related to TC core size • Juxtaposition of TC core relative to nearest • FoV positions Tb Anomaly (K) Pressure (mb)
AMSU Sensor Characteristics • Field of View (FoV) resolution varies across the scan swath due to the instrument’s cross-track scanning strategy • Best spatial resolution at nadir is ~50km • Spatial resolution variability needs to be taken into account relative to the TC core position in the swath. A TC core-sized warm anomaly viewed at 50km will be better resolved then at 80km. 80km 50 km 80 km FOV 1 FOV 30 Limb Limb Nadir
AMSU Sensor Characteristics Precipitation Effects • Radiative scattering due to eyewall hydrometeors can act to cool the Tb signal and mask the true warm core signal, especially for channels 6 and 7. The result is an underestimate of intensity. • This ‘contamination’ can be mitigated by comparing AMSU-A ch. 2 and 15 and then applying a statistical correction to ch. 4-8 TC core Corrected Hydrometeor scattering
AMSU Sensor Characteristics: Sub-Sampling Issues Compare to AMSU Footprint Adjust AMSU estimated pressure, if needed Eye size is used as a proxy for warm core size Eye Size (~2 x RMW) Near Limb Footprint Nadir Footprint
AMSU: Sub-Sampling Issues ARCHER (MW) Primary source of eye size: microwave estimate from ARCHER, if available If ARCHER not available then use IR estimate from ADT If neither is available use latest OFC estimate (ATCF) AMSU FOV ADT (IR) AMSU FOV
Developing the Relationship Between AMSU Tb and MSLP For channels 6/7/8, separate well-resolved cases out from the sub-sampled cases to develop the final regression relationships Well-resolved cases Tb Anomaly (K) Sub-sampled cases Pressure (mb)
Developing the Relationship Between AMSU Tb and MSLP CH 7 CH 6 Summary • Apply scattering correction to Tb’s • Remove sub-sampled cases • Regress Tb to MSLP anomaly for each channel and use relationships for initial estimates of MSLP anomaly CH 8
AMSU: Another Sub-Sampling Issue • Storm center may fall between nearest AMSU FOV centers • (“Bracketing Effect”) • Results in sub-sampling of the warm core • Use convolved AMSU-B moisture channels to assess • Adjust MSLP (only applied if initial MSLP est < 995 mb) Ch 16 – 89Ghz Ch 16 – 89Ghz • TC center between nearest FOVs • AMSU-B 89 Ghz Tb shows adjustment to AMSU TC estimate is necessary • TC center is well-centered on FOV • AMSU-B 89 Ghz indicates no adjustment needed
Relationship used to Adjust MSLP Estimate if “Bracketing Effect” Noted
Examples AMSU-A partially in eyewall - apply correction AMSU-A in center - no correction Iris 2001: Core is very small and nearest AMSU-A FOV is in moat. Signal suggests (incorrectly) that no correction is required. Eye smaller than AMSU-A FOV, - apply correction
Developing the Relationship Between AMSU Tb and MSLP • Start with regressions based on well-resolved cases and estimate • pressure anomaly for each channel • Use a weighted average of each channels pressure anomaly • contribution to get the final pressure anomaly • Make corrections for position within the scan swath (distance from • nadir) • Apply AMSU-B 98 Ghz Tb correction to account for bracketing • Use estimated eye size to correct for sub-sampling due to resolution
AMSU: Max Sfc Winds (MSW) Estimation • Start by removing storm motion component from the dependent sample validation (Best Track) MSW sample (1-min sust. wind) • Regress storm-relative MSW against AMSU-measured MSLP anomaly • Make situational corrections for Tb gradient of inner core, latitude, momentum transfer • Once all corrections are applied, add storm motion (from BT or ATCF in real time) to AMSU MSW estimate • AMSU MSW represents a 1-min sust. max sfc wind
AMSU: MSW Estimation Inner core gradient contribution to MSW estimate Warm core expanding Tight warm core AMSU Ch7 for Hurricane Isabel 2003
AMSU: MSW Estimation • Account for momentum transfer • Locate strongest 89 Ghz gradient within 150 km of center Decreased MSW from convective component AMSU 89Ghz for Hurricane Wilma 2005
AMSU: Performance Dependent Sample 1999-2006 MSLP in hPa, MSW in Kts Validation is recon-measured central pressure within 3 hours of AMSU pass for MSLP and recon-aided Best Track for MSW
AMSU: Performance Independent Sample MSLP in hPa, MSW in Kts Validation is recon-measured central pressure within 3 hours of AMSU pass for MSLP and recon-aided Best Track for MSW
AMSU: Performance Independent Sample 2007-2010 Cases < 45 knots MSLP in hPa, MSW in Kts Validation is recon-measured central pressure within 3 hours of AMSU pass for MSLP and recon-aided Best Track for MSW
Ongoing/Future Work • Re-examine MSW estimates using improved motion component • Address strong bias for weak storms caused by over-correcting Tb’s in the presence of center convection and associated hydrometeor scattering • Add more Depression-stage cases to the sample • Use improved fix accuracy from ARCHER position estimates to better correct errors from FOV “bracketing effect” • Explore SSMIS Sounder as a viable complement to AMSU for TC intensity estimates
SSMIS • Flown aboard active DMSP F16-18 satellites • Atmospheric sounding channels are similar to AMSU • Slightly different atmos contribution functions and peaks • Much improved resolution at 37 km which is consistent across the the scan swath due to the conical scanning strategy • Improved resolution of co-located imager channels allows for superior determination of TC structure info (eye size, RMW) at the time of the sounder TC intensity estimate
SSMIS SSMIS 91 Ghz AMSU 89 Ghz SSMIS F17 compared to AMSU NOAA-15 for Choi-Wan 2009 (15W) SDR Lower Air Sounder Tb’s adjusted to match AMSU Tb scale. Large eye allows both sensors to resolve warm core
SSMIS SSMIS CH4 54.4 Ghz (~300mb) AMSU CH6 54.46 Ghz (~400mb)
SSMIS AMSU CH8 55.5 Ghz (~180mb) SSMIS CH5 55.5 Ghz (~150mb)