Download
1 / 1
20 likes | 163 Views
v = { u, v }: Two-component Velocity Vector. T s : s-th Band Tracer or Optical Flow Intensity. Estimation of Surface Velocity from Geostationary Satellite Multiband Imagery. Wei Chen and Richard Mied Remote Sensing Division, Naval Research Laboratory, Washington, DC 20375. Objective :

E N D
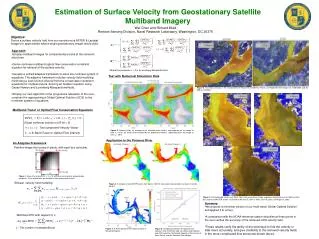
v = {u, v}:Two-component Velocity Vector Ts : s-th Band Tracer or Optical Flow Intensity Estimation of Surface Velocity from Geostationary Satellite Multiband Imagery Wei Chen and Richard Mied Remote Sensing Division, Naval Research Laboratory, Washington, DC 20375 Objective: Derive a surface velocity field from sun-synchronous ASTER & Landsat imagery to approximate what a single geostationary imager would yield. • Approach: • Employ multiband images for complementary looks at the coherent structures. • Derive nonlinear multiband optical flow conservation constraint equation for retrieval of the surface velocity. • Develop a unified adaptive framework to solve the nonlinear system of equations. The adaptive framework includes velocity field modeling, minimizing a cost function inferred from the conservation constraint equations for multiple tracers, deriving an iteration equation using Gauss-Newton and Levenberg-Marquardt methods. • Employ our own algorithm of the progressive relaxation of the over-constraint for approaching a Global Optimal Solution (GOS) to the nonlinear system of equations. Where the parameter 0is a Levenberg-Marquardt factor Test with Numerical Simulation Data Figure 6. Two flow scenarios in the section between Maryland and Mathias Points. (a) Flood tide from images on 11/28/2009, and (b) Ebb on 4/2/2003. Multiband Tracer or Optical Flow Conservation Equations (Exact nonlinear solution of dT/dt = 0) Figure 2. Velocity fields: (a) average of the modeled vector field is superimposed on the image at time t1 = 18 hr. (b) vector field estimated by the proposed method is superimposed on the image at time t2 = 20 hr. Application to the Potomac River An Adaptive Framework Partition image into boxes of pixels, with each box as below. Figure 1. A box (tile) of pixels (nx = ny = 9), with four corner points designated by red pixels. Pixel coordinates are located at their geometrical centers. Bilinear velocity field modeling. Figure 3. Examples of two ASTER tracers from April 4, 2003 in false color representation: (a) band 1 and (b) band 2. Figure 7. Estimated ebb, flood, and “slack” tides from a two-tracer image sequence acquired over the Potomac River by Landsat and ASTER at time 15:33 and 16:09 and UT, April 9, 2000, June 18, 2002, and August 5, 2002. • Summary: • We propose a nonlinear version of our multi-tracer Global Optimal Solution and applied it to a river. • A comparison with the NOAA reference station velocities at threepoints in the river verifies the accuracy of the retrieved GOS velocity field • These results verify the ability of the technique to find the velocity in tidal rivers accurately, and give credibility to the retrieved velocity fields in the more complicated flow structures shown above. -Minimize DFD with respect to v: S : The number of selected Bands Figure 4. A 70-km portion of the Potomac River in Maryland/Virginia. Figure 5. Comparison between the ground-truth velocities from the NOAA web site (Measured Velocity) and GOS velocities (Estimated Velocity) at Persimmon & Swan Points, and the Potomac River Bridge.