Download
1 / 14
150 likes | 392 Views
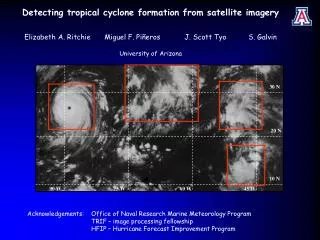
Detecting tropical cyclone formation from satellite imagery Elizabeth A. Ritchie Miguel F. Piñeros J. Scott Tyo S. Galvin University of Arizona. 30 N. 20 N. 10 N. 90 W. 75 W. 60 W. 45 W. Acknowledgements: Office of Naval Research Marine Meteorology Program

E N D
Detecting tropical cyclone formation from satellite imagery Elizabeth A. RitchieMiguel F. Piñeros J. Scott Tyo S. Galvin University of Arizona 30 N 20 N 10 N 90 W 75 W 60 W 45 W Acknowledgements: Office of Naval Research Marine Meteorology Program TRIF – image processing fellowship HFIP – Hurricane Forecast Improvement Program
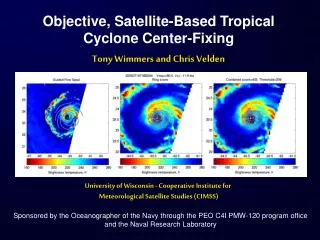
The Deviation-Angle Variance Technique (DAV-T) Hurricane Beta (2005) 350 km s2 q • - Produce the map of variance values • - produce a time series of the minimum variance value for a cloud system • - the lower the variance, the more organised the system
Low deviation-angle variances at early stages • 33 kt • NHC • first warning Hurricane Wilma 2005 Correlation: Total time series -0.93 From 25 kts on -0.92
ROC curve for IR imagery 1650 2000 1900 1850 1700 1950 1800 1750 1600 1550 Variance Thresholds 1500 True Positive Rate 1400/1450 1350 False Positive Rate
2004 & 2005 Time to Detection – “TD” TPR = 93% FPR = 22% TPR = 96% FPR = 40% Time [h] Variance Threshold [deg2]
What Next? • 1. Improve the True-Positive Rate while reducing the False-Alarms • - Add more information – water vapor channel • - Test sensitivity to some of the parameters in the technique • - Brightness threshold • 2. Increase the time-to-detection • - Add more information • - Test sensitivity to some of the parameters in the technique • 3. Increase the database to ensure statistical stability (ongoing) • 4. Develop a probabilistic Forecasting Protocol (Summer/10) • 5. Making the process of cloud tracking more efficient!! • - the Cloud-Tracking Interface
Water Vapor Imagery … and the “Cloud-Tracking Interface” • * Cloud-Tracking Interface • * Is a gui designed by a (desperate) undergraduate student to make the process more efficient (less boring) • * displays satellite imagery – can be stepped through in time • * stores the first time the minimum variance value meets a threshold in a database • * links to the NHC best-track database to display tracks and assign actual TCs to cloud clusters. Study:- Aug-Sep 2005 * Test sensitivity to Brightness Threshold
1700 1800 1800 1800 1700 1700 ROC curve Aug/Sep 2005 Inter-comparison True Positive Rate False Positive Rate
PoD: 100% FAR: 43% PoD: 85% FAR: 13% PoD: 92% FAR: 26% Mean Time to Detection Time (h) Threshold Minimum Variance Values
Conclusions • A completely objective technique to determine whether a cloud system will develop into a TC. • Water Vapor imagery gives similar PoD vs FAR results to IR • Mean detection times can be improved by use of WV imagery and by tuning some of the parameters • Best potential is using a combination of the two types of imagery – IR provides better PoD to FAR, WV provides earlier detection • Future Work:- • Continue to test the sensitivity to parameters • Develop a Forecaster protocol as per NHC needs
Thank you Piñeros, M. F., E. A. Ritchie, and J. S. Tyo 2008: Objective measures of tropical cyclone structure and intensity change from remotely-sensed infrared image data. IEEE Trans. Geosciences and remote sensing.46, 3574-3580. Piñeros, M. F., E. A. Ritchie, and J. S. Tyo 2010: Detecting tropical cyclone genesis from remotely-sensed infrared image data. (IEEE Trans. Geosciences and remote sensing.In Review)