Download

1 / 12
120 likes | 225 Views
The Primary Sources of Risk and a New Metric. Michael Schilmoeller Thursday May 19, 2011 SAAC. Outline. Sixth Plan regression analysis The nature of TailVaR 90 futures Per kWh cost metric. What do the Risky Futures Look Like?. See Appendix J of the Sixth Power Plan

E N D
The Primary Sources of Riskanda New Metric Michael Schilmoeller Thursday May 19, 2011 SAAC
Outline • Sixth Plan regression analysis • The nature of TailVaR90 futures • Per kWh cost metric
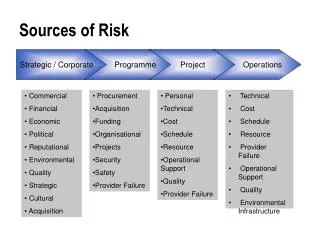
What do the Risky Futures Look Like? • See Appendix J of the Sixth Power Plan • Section Quantitative Risk Analysis identifies electricity prices, loads, carbon penalty, and natural gas prices to be the principal sources of risk • The issue of load is nettlesome
Regression Analysis Table J-3: Regression Model Coefficients • What do these have in common? Persistence.
Intuition About Risk • Worst Futures Spinner.xls
The Issue of Load is Nettlesome • Higher loads mean higher costs • Load growth is not typically associated with hardship for the regional ratepayer • There are more kWh over which to spread the cost of the existing and the new system • Without adjusting for kWh, TailVaR90 risk is dominated by high-load futures, and risk management is weighted toward resources that mitigate cost in high-load futures
The Act is Ambiguous On This • The Act directs the Council to reduce cost to BPA customers (utilities) and regional ratepayers • If load forecasts are not variable, NPV cost of the system is a good measure of economic efficiency • Where loads vary, as they do among futures, we need to reconsider the NPV metric
A New Metric • The Council’s NPV cost (and risk) currently includes all variable costs (e.g., fuel) for existing and new resources, and real levelized fixed costs for new resources. • A per kWh cost metric would include NPV of an estimate of annual embedded cost • We are interested in bills, not rates, so the total annual present value cost would be divided by the associated annual frozen efficiency load (kWh)
What do Plans Selected Using the Modified Metric Look Like? • CCCT permitting was unaffected • There were a few cases where fewer MW of SCCT were permitted by the end of the study (1,458 MW vs 1,620 MW) • Conservation premiums were capped ($70/MWh vs $100/MWh for discretionary conservation, $40/MWh vs $60/MWh for lost opportunity)
Would the committee support a recommendation to include this new metric for consideration in resource portfolio selection?