China
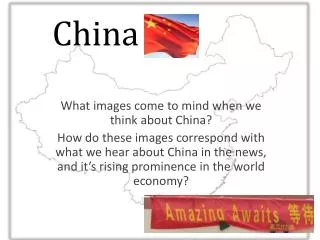
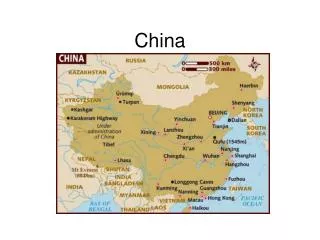
China. The worlds largest population 1/5 of the worlds total population Complex environment worlds largest and highest mountain plateau Two of the worlds longest rivers Many lakes Long coastline and continental shelf. China - geography.


China
E N D
Presentation Transcript
The worlds largest population1/5 of the worlds total populationComplex environmentworlds largest and highest mountain plateauTwo of the worlds longest riversMany lakesLong coastline and continental shelf China - geography Ecosystem range from glaciers, deserts, grassland, wetlands, tropical rainforest
Demographic and resource pressures • Population growth 2-3% pa from 1950-70s, has slowed down to 0.7% since the one child policy However: • Household numbers grows 3 times faster. • Household size have decreased from 4.5 to 3.5 people in 15 years. Estimated to be 2.2 by 2030 • Added another 8 mio. Households in 2000 • Per household floor area tripled in 30 years • Urbanization incr. from 13% to 39%from 1952-2003.
Population distribution Density highest in southeast 94% of population lives on 43% of the land
Fastest growing economy 10% paLargest producer of steel, television sets and aquaculture Largest consumption of coal, fertilizer, pesticides and tobacco Near the top in production of electricity, cars, chemical textiles 2003 production of steel, cement, chemical fiber and color TV incr. by 7, 13, 42, and 17214 times respectively China’s Economy
Consumption of meat, milk and egg increased 4, 4 and 8 fold respectively from 1978 to 2002. Number of vehicles increased 6 fold from 1980 to 1994 The traditional Township-Village Enterprises (TVE) very energy inefficient and based on coal Foreign investment in new industries better but double edged China’s Economy
China’s Policy • Believed that humans could and should conquer nature and that only capitalist countries suffered from environmental damage • This changed in 1972 when China attended the first United Nations Conference on the Human Environment • Environmental protection a basic national principle in 1983 • Strategy to achieve sustainability in 1994 • 2003 Sustainable development and harmony between man and nature • Rhetoric or reality – economy still main driver
In summary • Population and household growth + • Escalating production and consumption of natural resources + • Increased emission of air and water pollutant + • Increased affluence + • Considerable pressure on the natural resource base and environment +
Chinas environmental problems are among the most severe of any major country and are getting worse: Air pollution Land Degradation Cropland losses Desertification Disappearing wetlands Grassland degradation Soil erosion Overgrazing Salinization Water pollution and shortage Freshwater Groundwater depletion Oceans Loss of biodiversity – increase in invasive species Environmental Consequences
Most severe env. health problem • 3 out of 4 city dwellers live below Chinas air-quality standards • Acid rain fell on a quarter of cities for more than 60% of rainy days • High mortality rate from lung disease, • High rate of lung cancer because of smoking Air pollution Iron, steel and chemical factories spew sot, fly ash and sulfur dioxide into the air Pollutant trapped in the valley and within the walls of the city. 2 million people live Taiyuan – Shansi Province
Indoor air pollution. Women in XuanWei in Yunnan province has the highest lung cancer rate among Chinese women. From the burning of unclean coals in the homes without ventilation Improving as industries achieve emission standards – change from coal to gas CO2 emission - China
Social equity on CO2 emission • CO2 emission, largely a by-product of energy production and use • Low and middle income countries have seen a relatively much higher increase in CO2 emission
Second most severe env. health problem • Sewage, agricultural and industrial waste contaminates water supplies and cause many deceases • Much surface and groundwater is declared heavily polluted by heavy metals incl. lead, mercury, cadmium, arsenic and fluorides. • China’s per capita water availability only ¼ of world average - shortage Water pollution Arsenic contaminated water Skeletal fluorosis
Water Pollution • More than 700 mio people consume drinking water contaminated with levels of animal and human excreta that exceed maximum permissible levels by as much as 86% in rural areas and 28% in urban areas • By 1996 only 5% of industrial and 17% of domestic waste received any treatment before being discharged in rivers, lakes, oceans etc. However these percentages are increasing • Also dramatic increase in fresh water aquaculture
Cancer mortality from water pollution - TVE • Increase in cancer mortality over time in control area, polluted and most polluted townships • Show that increased pollution results in increased mortality • steady increase in cancer mortality over time in polluted areas Liver and stomach cancer deaths doubled since the 1970s. China has Highest liver cancer dead rate in the world
Cancer death and anemia from sewage storage - Urbanization Deceases investigated: • Cancer • Liver cancer • Esophageal cancer • Anemia In Control area Polluted area (along the canal) Most polluted area (near the lake) Baoding City disposed 250,000 tons of sewage per day into lake via a Canal
Cancer mortality and birth defects – changes to agriculture Impact of new practice of using industrial wastewater for irrigation 70 km long canal build in 1960, daily received 400,000 m3 of untreated wastewater from coalmines and petrochemical, power and chemical plants – increasing cancer mortality and birth defect
Production of aquaculture freshwater fish has increased steeply
Water Shortage • Unevenly distributed North only 1/3 of South • 100 cities suffer from severe shortages, halting industrial production. 300 cities out of Chinas 617 Cities suffer from shortage • 2/3 from groundwater mining – salt water intrusion in coastal areas and subsidence in some cities • World’s worst cessation of river flows. Yellow river stopped flowing during 20 of the years 1972-1997 • Number of days without flow up from 90 in 1980 to 230 in 1997
Competition rural urban intensifying: Residential use incr. from 31 to 134 bil. tons from 1995 to 2003 while industrial use Incr. from 52 to 269 bil. ton Farmers can not compete economically 1000 ton of water in agriculture = $200 while in industry it = $14,000 of profit. Virtual water? Water shortage The farmer holds a small irrigator used to lift water out of a canal using small buckets
The worlds largest water project – one of the worlds largest hydropower projects Average annual run –off 451 bil. ton Significant social and env. impact May silt up in 50 years Will move water to northern China The Yangtze Basin – Three Gorges dam
The Three Gorges Dam will move water from south to the north • Figure 1
Soil erosion affects 19% of land As a result of human activity, such as • Deforestation for agriculture and logging • Destruction of vegetation (grassland) • Cultivation on steep slopes • Drying out of wetlands for agriculture and city develop Consequences • Deposition of sediment in the river bed causing more frequent flooding leading to the deposition of coarse sediment particles and secondary alkalization • In one area more than doubling the area of eroded land from the 1960s to 80s
Over grazing- increase in number of goat, sheep and cattle Increasing desertification, the Gobi desert expanded by 52,400 km2 from 1994 to 1999 Winter storms create enormous dust storms affecting Korea and Japan
Arable land mainly in the east Arable land where most development takes place
Severity of Human Induced Soil Degradation The destruction of agricultural land poses a big problem for China’s food security
Consequences for China’s people • Socio-economic losses • $72 mil per year is spend to control just one weed imported from Brazil for pig forage • $250 mil in annual loss arising from factory closure due to shortage of water just in one city • Sand storm damage app $540 mil/year • Acid rain damage to crop and forest $730 mil/year • $6 bil cost of green wall to protect Beijing • $7 bil/year losses due to desertification • $7 bil/year due to losses from other alien species • $27 bil loss due to flood in 1998 • $54 bil/year losses due to water and air pollution
Consequences for China’s people • Health cost • 1996 to 2001 spending on public health incr. by 80% • App 300,000 death/year due to air pollution • Lead blood level in cities twice the level considered to be dangerous • Natural disasters • AD300 to 1949 dust storms once every 31 years. Since 1990 almost one every year – soil erosion • Drought damage about 160,000 km2 of cropland every year – double the area in 1950s • Increasing flood frequency
China in the global village • The shear size of China’s population, its landmass and economy guarantee that its environmental problems will spread to the rest of the world • Beneficial and harmful imports • China importing natural gas and oil– reduces environmental damage from the use of coal • Countries transferring pollution-intensive industries to China – using technology often prohibited in the exporting country • China paid to accept toxic trash from developed countries (increased from 1 mio to 11 mio t/p.a. 1990-1997) • Exports causing damage at home • Products go abroad but pollution stays at home
China in the global village • Invasive spices exported (chestnut blight, Dutch elm disease, Asian long-horned beetle) • Exports air pollution into the atmosphere • Exports deforestation. China’s import of wood has increased 6 fold; mainly from Malaysia, Papa New Guinea and Brazil
Chinas problem – A global issue • China largest contributor of • Sulfur oxides • Chorofluorocarbons • Ozone depleting substances and • Carbon dioxides
Chinas problem – A global issue • Dust and aerial pollutants already impact neighboring countries • Leading importer of tropical rainforest timber – a driving force behind tropical deforestation • What will happen if China achieves 1st world standard of living with 1st world environmental impact per capita
Are their any hope? • Increasingly participating in international treaties • Introducing better farming practices and some traditional environmentally friendly technologies • Becoming less energy intensive • WTO/Olympic caused China to pay more attention to air pollution • Phased out leaded petrol in little more than a year (took Europe and N.A. decades) • 1998 ban on logging and National Forest Conservation program • Grain-to-Green program in 2000, by 2010 130,000 km2 of cropland will be converted. One of the biggest conservation programs in the world
Destruction or losses of natural resources: • natural habitats • wild food sources • biological diversity • soil • 2. Ceiling of natural resources: • energy • freshwater • photosynthetic capacity • 3. Harmful things that we produce or move around: • toxic chemicals • alien species • atmospheric gases • 4. Population issues: • population is growing • per-capita impact