Download
1 / 28
280 likes | 435 Views
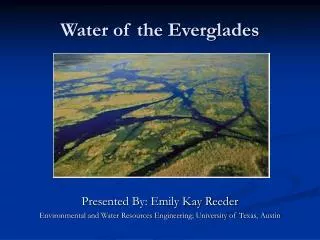
Characterization of Cellulolytic and Fermentative Communities in Everglades Soils. Ilker Uz Soil and Water Science Department University of Florida. Lake. Okeechobee. Everglades. ~ 1500. mgP. /kg. Agricultural Area. WCA. -. 1. WCA. -. 2A. WCA. -. 3. Cattail. Everglades.

E N D
Characterization of Cellulolytic and Fermentative Communities in Everglades Soils Ilker Uz Soil and Water Science Department University of Florida
Lake Okeechobee Everglades ~ 1500 mgP /kg Agricultural Area WCA - 1 WCA - 2A WCA - 3 Cattail Everglades National Park F1 ~ 500 mgP /kg U3 VEGETATION : Cattail Cattail/ sawgrass mix 0 1 2 3 4 5 Sawgrass/slough Km Sawgrass Widespread agricultural activity in the northern boundary of Florida Everglades has resulted in nutrient gradients, causing drastic physicochemical and ecological changes from the original system Nutrient inputs resulted in changes in vegetation
Plant Detritus Monomers and Oligomers Methanotrophs Fermentative Bacteria ANAEROBIC (propionate, butyrate, etc); H and CO alcohols 2 2 Homo acetogens Syntrophic Bacteria Acetate Acetate Acetate H and CO 2 2 Sulfate Reducing Methanogens Bacteria H S and CO CH 2 2 4 Introduction Anaerobic Carbon Cycle • Cellulose degradation • Fermentation • Syntrophy • Methanogenesis • Homoacetogenesis • Sulfate Reduction
Endoglucanase Glucosidase Exoglucanase Cellulose Degradation Aerobic Anaerobic Lynd et al. 2002. Microbiol.Mol. Biol. Rev. 66(3): 506-577.
Fermentation An energy-yielding metabolic process in which an organic compound serves as both an electron donor and an electron acceptor. (Madigan et al. 1997. Brock Biology of Microorganisms)
Glucose H2 utilizing bacteria H2 Butanol CO2 Butyrate Acetone Acetate Syntrophs Methanogens Methane Lactate Propionate Ethanol
Genus Clostridium • Gram positive • Endospore forming • Obligate anaerobic • Contains the majority of anaerobic cellulolytic bacteria. • Also contains noncellulolytic fermentation bacteria. • Highly diverse in 16S rRNA gene sequence and divided into 19 clusters.
Cellulose degradation and fermentation are two of the most studied microbial processes in laboratory conditions. • However: • Little is known about the ecology of cellulolytic and fermentative bacteria. • Their ecology must be investigated to understand true microbial nature of the Everglades and impact of nutrient loading on carbon cycling mechanism.
Hypothesis Composition and metabolism of cellulolytic and fermentative Clostridium group is function of the nutritional status of the Everglades soil.
H1: Accumulation of nutrient rich organic material in impacted site correlates with relatively larger population size in cellulolytic community. H2: Nutritional status of soils correlates with the composition of cellulolytic and fermentative species. H3: Impacted soils contain a microbial community that is poised to respond more rapidly to changes in nutritional status compared to nonimpacted soils.
Specific Objectives • Characterization of fermentation processes and fermentation product pattern under different carbon sources. • Assessment of cellulolytic and fermentative bacterial assemblages. • Standardization and application of T-RFLP method for the Everglades Soils.
The Everglades WCA-2A Impacted (F1) zone Transition (F4) zone Nonimpacted (U3) zone Blue Cypress Marsh Impacted zone Nonimpacted zone Material and Method Soil Samples Samples from 0-10 cm depth will be used
Most Probable Number (MPN) Counting • Anaerobic Cellulolytic Microorganisms • Fermentative Microorganisms • Molecular analysis of MPN dilutions • Universal 16S rRNA gene Primers • Isolation of Microorganisms From Soil Samples • Roll tube method (cellulolytic bacteria) • Glucose enrichment and glucose agar plate technique (fermentative bacteria)
Objective 1: Fermentation • Microcosms • Liquid media with basic nutrients and vitamins • Soil • Carbon source • Glucose • Cellulose • Plant material (dried crushed cattail and sawgrass) • Plant material (no P addition in the media) • Measurement of fermentation products in microcosms • Acetate, butyrate, propionate, lactate, isobutyrate • Methane
Isolate DNA Correct fragment size PCR Soil Clone Mixed rDNA fragment ATCGATCG Sequence clones PCR cloning vector Transform to E. coli Objective 2: Molecular Ecology
Phylogenetic Analysis Analysis of rRNA gene sequences and determination of their places in the taxonomy. • In-silico alignment of sequences • Creation of phylogenetic tree
Isolate DNA PCR One primer labeled Soil Digest with enzymes (Mixed template) Sp. A Sp. C Sp. B Automatic sequencer Detects labeled fragment Size of labeled fragment Objective 3: T-RFLP Analysis
Results • Most Probable Number (MPN): Everglades Blue Cypress
Glucose Microcosms Everglades-Impacted mM mmole/g methane Everglades-Nonimpacted mmole/g methane mM
Blue Cypress-Impacted mM mmole/g methane Blue Cypress-Nonimpacted mM mmole/g methane
0.1 substitutions/site Clostridium termitidis 100 Fig. Phylogenetic tree of Clostridium cluster III 16S rRNA gene clone sequences obtained from soil samples from F1 (F), F4 (T), U3 (U). 77 Clostridium cellobioparum Clostridium papyrosolvens U3 99 F4 Clostridium cellulolyticum 100 Clostridium josui F2 100 U8 89 U27 F1 F8 U19 72 T26 T14 99 T8 Cluster III F14 F7 Bacteroides cellulosolvens U1 Acetivibrio cellulolyticus 100 100 Acetivibrio cellulolyticus Clostridium aldrichii U2 71 T3 U33 Clostridium stercorarium T25 U4 U11 92 F10 U16 Clostridium thermocellum T11 100 F3 Clostridium acetobutylicum 100 Cluster I 100 Clostridium butyricum Clostridium tetanomorphum Clostridium glycolicum 100 Cluster XI Clostridium bifermentans 100 Clostridium ghonii 86 Clostridium sordellii Rhodococcus opacus
78 T10 Fig. Phylogenetic tree of Clostridium cluster I 16S rRNA gene clone sequences obtained from soil samples from F1 (F), F4 (T), U3 (U). 0.1 substitutions/site 95 U3-9 100 F1-19 F1-13 F1-26 62 F1-8 F1-2 U3-33 U3-22 100 U3-1 100 U3-20 U15 100 F1-25 99 F1-20 F3 92 U3-7 U3-19 100 U5 U3-30 76 100 T12 F17 T3 Clostridium glycolicum 100 100 Clostridium mangenotii 80 Cluster XI Clostridium bifermentans 100 96 Clostridium ghonii Clostridium sordellii Clostridium thermocellum 100 Clostridium cellulolyticum 100 Cluster III 100 Clostridium termitidis Clostridium papyrosolvens Rhodococcus opacus T4 F1 Clostridium quinii 65 T21 T6 65 T5 83 63 Clostridium disporicum T1 95 T30 F1, F4 and U3 Clostridium paraputrificum F15 Clostridium chromoreductans T29 Clostridium butyricum 62 Clostridium favososporum U28 Only F1 and U3 T36 Clostridium acetobutylicum T41 T16 93 Clostridium saccharobutylicum Clostridium saccharoperbutylacetonicum Clostridium cellulovorans 68 100 Sarcina ventriculi Sarcina maxima 86 Clostridium fallax F18 86 Clostridium bowmanii 60 T2 72 Clostridium tunisiense 94 Clostridium argentinense Clostridium tetanomorphum 100 Clostridium pasteurianum Clostridium acidisoli U44 Clostridium ragsdalei Clostridium carboxidivorans 60 T24 79 Clostridium magnum T26
Summary • Impacted soils shows higher and faster metabolic activity. • Fermentation process seems to be similar in impacted and nonimpacted soil microcosms. (Based on glucose depletion and acetate production trend data) • Difference in fatty acid accumulation and depletion pattern may be more dependent of syntrophic activity rather than type of fermentation bacteria.
Summary Based on microcosm studies, type of plant material as carbon and nutrient source • does not appear to be important in the Everglades soils. • created significant difference in Blue Cypress Marsh.
Summary • Microbial community structure is affected by the nutrient loading. • It is a possibility that the composition of fermentation bacteria depend on activity of higher trophic bacterial groups. • Differences observed in phylogenetic analysis may be used as indicator to monitor bacterial changes.
Summary • Impacted sites contain larger celluloytic community.