Soils Genesis and Characterization
310 likes | 521 Views
Soils Genesis and Characterization. Department of Agricultural and Biological Engineering. University of Illinois at Urbana-Champaign. 95B—Southern Wisconsin and Northern Illinois Drift Plain 98—Southern Michigan and Northern Indiana Drift Plain 105—Northern Mississippi Valley Loess Hills

Soils Genesis and Characterization
E N D
Presentation Transcript
Soils Genesis and Characterization Department of Agricultural and Biological Engineering University of Illinois at Urbana-Champaign
95B—Southern Wisconsin and Northern Illinois Drift Plain 98—Southern Michigan and Northern Indiana Drift Plain 105—Northern Mississippi Valley Loess Hills 108A and 108B—Illinois and Iowa Deep Loess and Drift 110—Northern Illinois and Indiana Heavy Till Plain 113—Central Claypan Areas 114B—Southern Illinois and Indiana Thin Loess and Till Plain, Western Part 115A, 115B, and 115C—Central Mississippi Valley Wooded Slopes 120B—Kentucky and Indiana Sandstone and Shale Hills and Valleys, Northwestern Part 131A—Southern Mississippi River Alluvium 134—Southern Mississippi Valley Loess
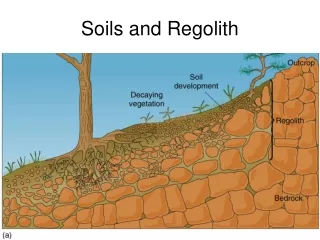
Typical cross section showing the relationship of parent materials to soils in Cass County.
Sable Silty Clay Loam This poorly drained "prairie soil" formed in more than 60 inches of loess. There are about 925,000 acres mapped in Illinois. It has a PI of 155.
Typical pattern of soils and parent material in the Drummer-Flanagan association.
Drummer Silty Clay Loam This poorly drained "prairie soil" formed in 40 to 60 inches of loess over Wisconsinan drift. It occupies nearly 1.6 million acres. It has a high management level productivity index (PI) of 150.
Typical pattern of soils and parent material in the Hoyleton-Cisne association.
Cisne Silt Loam This poorly drained "gray prairie soil" formed in 30 to 55 inches of loess over Illinoian drift. About 730,000 acres occur in south central Illinois. It has a PI of 115.
Typical pattern of soils and parent material in the Titus-Beaucoup-Tice association.
Soil Constituents Solid Particles Soil Solution Air
Saturated (all pores filled) (Some air, some water) Field Capacity Wilting point (water too tightly held for plant use)
Hydroscopic Water Gravitational Water Capillary Water Water adheres to soil particles Water held in large pores Available for crop use Water drains through soil profile Wilting Point Field Capacity
Flowing Tile Positive Pressure i.e. Saturation must occur above tile drains for water to enter.
Simplified Soil Texture Triangle Soils with more than30% clay are Clays Soils with 20 - 30% clay are Clay Loams Soils with less than 20% clay are Loams unless they have more than 80% sand Soils with more than 80% sand are Sands Soils with more than 50% sand are Sandy Soils with more than 50% silt are Silty Sable
Classification by Permeability 1 Rapidly permeable More than 6 inches per hour Moderately rapidly permeable 2 to 6 inches per hour 2 Moderately permeable 0.6 to 2 inches per hour 3 Moderately slowly permeable 0.2 to 0.6 inch per hour 4 Slowly permeable 0.06 to 0.2 inch per hour Very slowly permeable less than 0.06 inch per hour
Classification by Natural Drainage A Poorly drained The water table is at or near the surface during the wetter seasons of the year Very poorly drained The water table remains near, at, or above the surface much of the time B Somewhat poorly drained The water table is near the surface only during the very wettest periods
Soil Drainage Groups DRAINAGE GROUP 4A (slowly and very slowly permeable, poorly or very poorly drained) 2 Cisne 84 Okaw 165 Weir 287 Chauncey 12 Wynoose 109 Racoon 206 Thorp 460 Ginat 16 Rushville 112 Cowden 208 Sexton 474 Piasa 26 Wagner 120 Huey 218 Newberry 576 Zwingle 45 Denny 136 Brooklyn 261 Niota 633 Traer DRAINAGE GROUP 2A (moderately permeable, poorly or very poorly drained) 67 Harpster 142 Patton 244 Hartsburg 594 Reddick 68 Sable 152 Drummer 252 Harvel 648 Clyde 125 Selma 153 Pella 329 Will 316 Romeo
A cube of soil measures 10 x 10 x 10 cm and has a total (wet) mass of 1460 g, of which 260 g is water. Determine the volumetric water content, soil porosity, and degree of saturation. Volumetric water content Volume of soil = 10x10x10 = 1000 cm3 Volume of water = mass of water/density of water = 260 (g) /1 (g/cm3) = 260 cm3 Volumetric water content = volume of water/volume of soil = 260/1000 = 0.26
A cube of soil measures 10 x 10 x 10 cm and has a total (wet) mass of 1460 g, of which 260 g is water. Determine the volumetric water content, soil porosity, and degree of saturation. Porosity Mass of solids = wet mass of soil – mass of water = 1460 – 260 = 1200 g Volume of solids = mass of solids/density of solids = 1200 (g) / 2.65 (g/cm3) = 452.8 cm3 Volume of fluids = total volume – volume of solids = 1000 – 452.8 = 547.2 cm3 Porosity = volume of fluids/volume of soil = 547/1000 = 0.55
A cube of soil measures 10 x 10 x 10 cm and has a total (wet) mass of 1460 g, of which 260 g is water. Determine the volumetric water content, soil porosity, and degree of saturation. Degree of Saturation Degree of saturation = volume of water/volume of fluids = 260/547 = 0.475 = 47.5%
A bucket contains 22 kg of soil for which the gravimetric water content (mass of water/mass of solids) was found to be 0.18. Determine the volume of water in the bucket.. Gravimetric water content = mass of water/mass of solids 0.18 = mass of water/(22 – mass of water) mass of water = 22 x 0.18 – 0.18 * mass of water 1.18 * mass of water = 3.96 kg mass of water = 3960 (g) /1.18 = 3356 g Volume of water = mass of water/density of water = 3356 (g) /1 (g/cm3) = 3356 cm3
A 90 cm soil column has a volumetric water content of 0.12. Determine the quantity of water that must be added to bring the volumetric water content up to 0.30 Required volume (depth) of water = 90 x 0.3 = 27 cm Current volume (depth) of water = 90 x 0.12 = 10.8 cm Additional volume (depth) of water = 27 – 10.8 = 16.2 cm
Determine the gravity drainable volume (depth) and the plant-available soil water storage capacity in the following soil from Logan County, Illinois. (Porosity = 1 – dry bulk density/2.65)
Determine the gravity drainable volume (depth) and the plant-available soil water storage capacity in the following soil from Logan County, Illinois. (Porosity = 1 – dry bulk density/2.65) • Depth (cm) • Depth Increment (cm) • Porosity (%) • Gravity drainable porosity (%) • Gravity drainable volume (cm) • 1/3 bar w.c. – 15 bar water content • Plant available water (cm) 0-18 18 51 26.9 4.84 24.1 4.34 18-38 20 46 19.9 3.98 26.1 5.22 38-51 13 42 15.7 2.04 26.3 3.42 51-66 15 38 8.1 1.22 29.9 4.49 66-94 28 40 11.2 3.14 28.8 8.06 94-130 26 39 14.6 3.80 24.4 6.34 Sum =19.02 Sum = 31.87