Download
1 / 1
10 likes | 168 Views
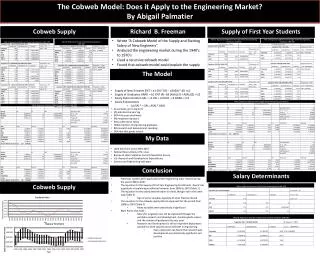
The Cobweb Model: Does it Apply to the Engineering Market? By Abigail Palmatier. Cobweb Supply. Supply of First Year Students. Wrote “A Cobweb Model of the Supply and Starting Salary of New Engineers” Analyzed the engineering market during the 1940’s to 1970’s Used a recursive cobweb model

E N D
The Cobweb Model: Does it Apply to the Engineering Market?By Abigail Palmatier Cobweb Supply Supply of First Year Students • Wrote “A Cobweb Model of the Supply and Starting Salary of New Engineers” • Analyzed the engineering market during the 1940’s to 1970’s • Used a recursive cobweb model • Found that cobweb model could explain the supply of new engineers RichardB. Freeman The Model • Supply of New Entrants ENT = a1 SAL* (0) – a2ASAL* (0) +u1 • Supply of Graduates GRAD = b1 ENT (4) -b3 [ASAL(3) + ASAL(2)] +U2 • Salary Determination SAL = c1 RD + c2 DUR - c3 GRAD + U3 • Salary Expectations • (a) SAL* = SAL; ASAL* ASAL • All variables are in log form • (#) indicates the year lag • ENT=first year enrollment • SAL=engineering salary • ASAL=alternative salary • GRAD=number of engineering graduates • RD=research and development spending • DUR=durable goods output My Data • Used data from years 1983-2007 • Federal Reserve Bank of St. Louis • Bureau of Labor Statistics Current Population Survey • U.S. Research and Development Expenditures • Science and Engineering Indicators Conclusion Salary Determinants • Freemans models don’t apply well to the engineering labor market during the years 1989 to 2007 • The equation for the Supply of First-Year Engineering Enrollments doesn’t do a good job at explaining enrollment behavior from 1989 to 2007 (Table 1) • The equation for the salary determination still held, though not in the same way (Table 2) • Sign of some variables opposite of what Freeman found • The equation for the cobweb supply did not apply well for the period from 1989 to 2007 (Table 3) • Many variables were statistically insignificant • Main Points that held: • Salary for engineers can still be explained through the variables research and development, durable goods output, and the number of graduates the year prior • Research and Development is still an important explanatory variable for both salaries and enrollment in engineering • Every regression ran found that research and development was statistically significant and positive Cobweb Supply