Market Risk
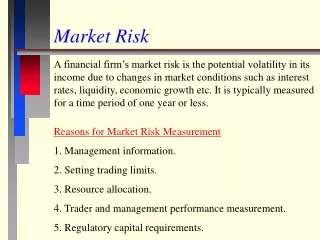
Market Risk FIN 653 From Saunders and Cornett Ch. 10 Market Risk I. Market Risk Management Market risk is defined as the uncertainty of an FI's earnings resulting from changes in market conditions such as the price of an asset, interest rates, market volatility, and market liquidity.


Market Risk
E N D
Presentation Transcript
Market Risk FIN 653 From Saunders and Cornett Ch. 10 Market Risk
I. Market Risk Management • Market risk is defined as the uncertainty of an FI's earnings resulting from changes in market conditions such as the price of an asset, interest rates, market volatility, and market liquidity.
I. Market Risk Management • Five reasons why market risk measurement is important: • 1. Management Information. • Provides senior management with information on the risk exposure taken by traders. This risk exposure can then be compared to the capital resources of the Fl. • 2. Setting Limits. • Measures the market risk of traders' portfolios, which will allow the establishment of economically logical position limits per trader in each area of trading.
I. Market Risk Management • 3. Resource Allocation. • Compares returns to market risks in different areas of trading, which may allow the identification of areas with the greatest potential return per unit of risk into which more capital and resources can be directed. • 4. Performance Evaluation. • Calculates the return-risk ratio of traders, which may allow a more rational evaluation of traders and a fair bonus system to be put in place. • 5. Regulation. • With the BIS and Federal Reserve proposing to regulate market risk through capital requirements, private sector benchmarks are important if it is felt that regulators are overpricing some risks.
II. The Variance-Covariance Approach • 1. JPM's RiskMetrics Model • Dennis Weatherstone, former chairman of J. P. Morgan (JPM): • "At close of business each day tell me what the market risks are across all businesses locations." In a nutshell, the chairman of J. P. Morgan wants a single dollar number at 4:15 PM New York time that tells him J. P. Morgan's market risk exposure on that day. • For a FI, it is concerned with how much it could potentially lose should market conditions move adversely; • Market risk = Estimated potential loss under adverse circumstances
II. The Variance-Covariance Approach • 1. JPM's RiskMetrics Model • VaR can be defined as the worst loss that might be expected from holding a security or portfolio over a given period of time, given a specific level of probability. • Example: A position has a daily VaR of $10m at the 99% confidence level means that the realized daily losses from the position will, on average, be higher than $10m on only one day every 100 trading days. • VaR is the answer to the following questions: • “What is the maximum loss over a given time period such that there is a low probability that the actual loss over the given period will be larger (than the VaR)?”
II. The Variance-Covariance Approach • 1. JPM's RiskMetrics Model • VaR is not the answer to: • “How much can I lose on my portfolio over a given period of time?” • The answer to this question is “everything”. • VaR does not state by how much actual losses will exceed the VaR figure. • It simply states how likely it is that the VaR figure will be exceeded.
II. The Variance-Covariance Approach • Three measurable components for the FI's daily earnings at risk: • Daily earnings at risk (DEAR) = (Dollar value of the position) * ( Price sensitivity ) * (Potential adverse move in yield) • or • Daily earnings at risk (DEAR) = (Dollar value of the position) * (Price volatility)
II. The Variance-Covariance Approach • A. The Market Risk of Fixed -Income Securities • Suppose an FI has a $1 million market value position in zero-coupon bonds of seven years to maturity with a face value of $1,631,483. Today's yield on these bonds is 7.243 percent per annum. These bonds are held as part of the trading portfolio. Thus: • Dollar value of position = $1 million
II. The Variance-Covariance Approach • The FI manager wants to know the potential exposure faced by the FI should a scenario occur resulting in an adverse or reasonably bad market move against the FI. How much will be lost depends on the price volatility of the bond. From the duration model we know that:
II. The Variance-Covariance Approach • Daily price volatility = (Price sensitivity to a small change in yield) * (Adverse daily yield move) • = (-MD) * (Adverse daily yield move) • The modified duration (MD) of this bond is: • D 7 • MD = --------- = -- ----------- = 6.527 • 1+R (1.07243) • given the yield on the bond is R = 7.243 percent.
II. The Variance-Covariance Approach • Suppose we want to obtain maximum yield changes such that there is only a 5 percent chance the yield changes will be greater than this maximum in either direction. • Assuming that yield changes are normally distributed, then 90 percent of the area under normal distribution is to be found within 1.65 standard deviations from the mean-that is, 1.65. • Suppose over the last year the mean change in daily yields on seven-year zeros was 0 percent while the standard deviation was 10 basis points (or 0.1%), so 1.65 is 16.5 basis points (bp).
II. The Variance-Covariance Approach • Then: • Price volatility = (-MD)* (Potential adverse move in yield) • = (-6.527)* (.00165) • = .01077 or 1.077% • and • Daily earnings at risks = (Dollar value of position) * (Price volatility) • = ($l,000,000)* (.01077) • = $10,770
II. The Variance-Covariance Approach • Extend this analysis to calculate the potential loss over 2, 3, ....., N days. Assuming that yield shocks are independent, then the N-day market risk (VAR) is related to daily earnings at risk (DEAR) by: • VAR = DEAR x N • If N is 5 days, then: • VAR = $10,770 x 5 • = $24,082 • If N is 10 days, then: • VAR = $10,770x 10 • = $34,057
II. The Variance-Covariance Approach • Technical Clarification 1: Normal Return Distribution • F ( R ) =
II. The Variance-Covariance Approach • If c denotes the confidence level, say 99%, then R* is defined analytically by • Prob(R<R*) = • = Prob (Z < (R*- )/ ) • = 1-c
II. The Variance-Covariance Approach • Z = (R- )/ denotes a standard normal variable, N(0,1) with mean 1 and unit standard deviation. • The cut-off return R* can be expresses as: • R* = + • Where the threshold limits, , as a function of confidence level: • C = (R*- )/ • _____________________________________ • 99.97% -3.43 • 99.87% -3.00 • 99% -2.33 • 95% -1.65
II. The Variance-Covariance Approach • Technical Clarification 2: Derive the 10-day VaR from the daily VaR • If assume that markets are efficient and daily returns, Rt, are independent and identically distributed, then the 10-day return R(10) = Rt, is also normally distributed with mean 10 = 10 , and variance 210 = 10 2, since it is the sum of 10 i.i.d. normal variables. It follows that • VaR (10;c) = 10 * VaR (1; c)
II. The Variance-Covariance Approach • B. Foreign Exchange • Suppose the bank had a DM 1.6 million trading position in spot German Deutsch marks. What is the daily earnings at risk? • The first step: calculate the dollar amount of the position: • Dollar amount of position • = (FX position) * (DM/$; spot exchange rate) • = (DM 1.6 million) * ($0.625/DM) • = $1 million
II. The Variance-Covariance Approach • Suppose that the of the daily changes on the spot exchange rate was 56.5 bp over the past year. • We are interested in adverse moves--that is, bad moves that will not be exceeded more than 5 percent of the time or 1.65 . • FX volatility = 1.65 x 56.5 bp = 93.2 bp • Thus: • DEAR = (Dollar amount of position) * (FX volatility) • = ($1 million)x (.00932)= $9,320
II. The Variance-Covariance Approach • C. Equities • From the Capital Pricing Model (CAPM): • Total risk = Systematic risk + Unsystematic risk • 2it = 2 it2 mt + 2 eit • Systematic risk reflects the movement of that stock with the market (reflected by the stock's beta ( it ) and the volatility of the market portfolio ( mt), while unsystematic risk is specific to the firm itself ( eit)·
II. The Variance-Covariance Approach • In a very well-diversified portfolio, unsystematic risk can be largely diversified away, leaving behind systematic (undiversifiable) market risk. • Suppose the FI holds a $1 million trading position in stocks that reflect a U.S. market index (e.g., the Wilshire 5000). Then DEAR would be: • DEAR = (Dollar value of position) * (Stock market return volatility) • = ($l,000,000)* (1.65 m).
II. The Variance-Covariance Approach • If, over the last year, the m of the daily changes in returns on the stock index was 2 percent, then 1.65 m = 3.3 percent. • DEAR = ($1,000.000) * (0.033) • = $33,000 • In less well-diversified portfolios, the effect of unsystematic risk eit, on the value of the trading position would need to be added. • Moreover, if the CAPM does not offer a good explanation of asset pricing say, multi-index arbitrage pricing theory (APT), a degree of error will be built into DEAR calculation.
II. The Variance-Covariance Approach • D. Portfolio Aggregation • Consider a portfolio consists of • seven-year, zero-coupon, fixed-income ($1 million market value), • spot DM ($1 million market value), and • the U.S. stock market index ($l million market value). • The individual DEARS were: • 1. Seven-year zero = $10,770 • 2. DM spot = $9,320 • 3. U.S. equities = $33,000
II. The Variance-Covariance Approach • Correlations ( ij ) among Assets • Seven-year DM/$ U.S. stock Zero index • ___________________________________________ • Seven-year - -.2 .4 • DM/$ - .1 • U.S stock index - - • ___________________________________________
II. The Variance-Covariance Approach • Using this correlation matrix along with the individual asset DEARs, we can calculate the risk of the whole trading portfolio: • DEAR portfolio = [ (DEARZ) 2 + (DEARDM) 2 • + (DEARU.S) 2+ (2 * Z,DM * DEARZ * • DEARDM) + (2 x Z,U.S * DEARZ *DEARU.S) • + (2 * U.S,DM * DEARUS * DEARDM )]1/2 • = [(10.77)2 + (9.32)2+ (33)2 + • 2(.2)(10.77)(9.32) + 2(.4)(10.77)(33) • + 2(.1)(9.32)(33)] 1/2 • = $39,969
II. The Variance-Covariance Approach • In actuality, the number of markets covered by JPMs traders and the correlations among those markets require the daily production and updating of over volatility estimates ((T) and 53,628 correlations (P).
II. The Variance-Covariance Approach • RiskMetrics: Volatilities and Correlations • Number of Number of Total Markets Points • ____________________________________________________ • Term structures • Government bonds 14 7-10 120 • Money markets and 15 12 180 • and swaps • Foreign exchange 14 1 14 • Equity indexes 14 1 14 • Volatilities 328 • Correlations 53,628 • ____________________________________
III. Historical or Back Simulation Approach • A major criticism of RiskMetrics is the need to assume a symmetric (normal) distribution for all asset returns. • The advantages of the historical approach: • (1) it is simple, • (2) it does not require that asset returns be normally distributed, and • (3) it does not require that the correlations or standard deviations of asset returns be calculated.
III. Historical or Back Simulation Approach • The essential idea is to take the current market portfolio of assets and revalue them on the basis of the actual prices that existed on those assets yesterday, the day before that, and so on. • The FI will calculate the market or value risk of its current portfolio on the basis of prices that existed for those assets on each of the last 500 days. It would then calculate the 5 percent worst case, that is, the portfolio value that has the 25th lowest value out of 500.
III. Historical or Back Simulation Approach • Example: At the close of trade on December 1, 2000, a bank has a long position in Japanese yen of 500,000,000 and a long position in Swiss francs of 20,000,000. If tomorrow is that one bad day in 20 (the 5 percent worst case), how much does it stand to lose on its total foreign currency position? • Step 1: Measure exposures. • Convert today's foreign currency positions into dollar equivalents using today's exchange rates.
III. Historical or Back Simulation Approach • Step 2: Measure sensitivity. • Measuring sensitivity of each FX position by calculating its delta, where delta measures the change in the dollar value of each FX position if the yen or the Swiss franc depreciates by 1 percent. • Step 3: Measure risk. • Look at the actual percentage changes in exchange rates, yen/$ and Swf/$, on each of the past 500 days. • Combining the delta and the actual percentage change in each FX rate means a total loss of $47,328.9 if the FI had held the current Y 500,000,000 and Swf 20,000,000 positions on that day (November 30, 2000).
III. Historical or Back Simulation Approach • Step 4: Repeat Step 3. • Step 4 repeats the same exercise for the positions but using actual exchange rate changes on November 29, 2000; November 28, 2000; and so on. For each of these days the actual change in exchange rates is calculated and multiplied by the deltas of each position. • Step 5: Rank days by risk from worst to best. • The worst-case loss would have occurred on May 6, 1999, with a total loss of $105,669. • We are interested in the 5 percent worst case. The 25th worst loss out of 500 occurred on November 30, 2000. This loss amounted to $47,328.9.
III. Historical or Back Simulation Approach • Step 6. VAR. If assumed that the recent past distribution of exchange rates is an accurate reflection of the likely distribution of FX rate changes in the future--that exchange rate changes have a "stationary" distribution--then the $47,328.9 can be viewed as the FX value at risk (VAR) exposure of the FI on December 1, 2000. This VAR measure can then be updated every day as the FX position changes and the delta changes.
III. Historical or Back Simulation Approach • Table: Hypothetical Example of the Historical or Back Simulation Approach • Yen Swiss Franc • ____________________________________________________ • Step 1: Measure Exposure • 1. Closing position on Dec. 1, 2000 500,000,000 20,000,000 • 2. Exchange Rate on Dec. 1, 2000 Y130/$1 Swf1.4/$1 • 3. U.S. $ equivalent position • on Dec. 1, 2000 3,846,154 14,285,714 • Step 2: Measuring Sensitivity • 4. 1.01*current exchange rate Y131.3/$1 Swf1.414/$1 • 5. revalued position in $ 3,808,073 14,144,272 • 6. Delta of position -38,081 -141,442
III. Historical or Back Simulation Approach • Step 3: Measuring risk of Dec. 1, 2000, closing position using exchange rates that existed on each of the last 500 days • November 30, 2000 Yen Swiss Franc • ____________________________________________________ • 7. Change in exchanger rate • (%) on Nov. 30, 2000 0.5% 0.2% • 8. Risk (delta*change in • exchange rate) -19,040.5 -28,288.4 • 9. Sum of risks = -$47,328.9 • ____________________________________________________ • Step 4: Repeat Step 3 for each of the remaining 499 days
III. Historical or Back Simulation Approach • Step 5: Rank days by risk from worst to best • Date Risk ($) • __________________________________________________ • 1. May 6, 1999 -$105,669 • 2. Jan 27, 2000 -$103,276 • 3. Dec 1, 1998 -$90,939 • ………. • 25. Nov 30, 2000 -$47,329 • ………. • 500 July 28, 1999 -$108,376 • ____________________________________________________ • Step 6: VAR (25th worst day out of last 500) • VAR = -$47,328.9 (Nov. 30, 2000)
III. Historical or Back Simulation Approach • Advantages of the Historic (Back Simulation) Model versus RiskMetrics: • No need to calculate standard deviations and correlations to calculate the portfolio risk figures. • It directly provides a worse-case scenario number. RiskMetrics, since it assumes asset returns are normally distributed--that returns can go to plus and minus infinity--provides no such worst-case scenario number.
III. Historical or Back Simulation Approach • The disadvantage: • The degree of confidence we have in the 5 percent VAR number based on 500 observations. • Statistically speaking, 500 observations are not very many, and so there will be a very wide confidence band (or standard error) around the estimated number ($47,328.9 in our example). • One possible solution is to go back in time more than 500 days and estimate the 5 percent VAR based on 1,000 past observations (the 50th worst case) or even 10,000 past observations (the 500th worst case). The problem is that as one goes back farther in time, past observations may become decreasingly relevant in predicting VAR in the future.
IV. The Monte Carlo Simulation Approach • To overcome the problems imposed by a limited number of actual observations, additional observations can be generated. • The first step is to calculate the historic variance-covariance matrix () of FX changes. This matrix is then decomposed into two symmetric matrices, A and A'. The only difference between A and A' is that the numbers in the rows of A become the numbers in the columns of A'.
IV. The Monte Carlo Simulation Approach • This decomposition then allows us to generate "scenarios" for the FX position by multiplying the A' matrix by a random number vector z: 10,000 random values of z are drawn for each FX exchange rate. The A' matrix, which reflects the historic correlations among FX rates, results in realistic FX scenarios being generated when multiplied by the randomly drawn values of z. The VAR of the current position is then calculated, except that in the Monte Carlo approach the VAR is the 500fh worst simulated loss out of 10,000.
V. Regulatory Models: The BIS Standardized Framework • The 1993 BIS proposals regulate the market risk exposures of banks by imposing capital requirements on their trading portfolios. • Since January 1998 the largest banks in the world are allowed to use their own internal models to calculate exposure for capital adequacy purposes, leaving the standardized framework as the relevant model for smaller banks.
V. Regulatory Models: The BIS Standardized Framework • 1. Fixed Income • 1. The specific risk charge is meant to measure the risk of a decline in the liquidity or credit risk quality of the trading portfolio over the FI's holding period. • Treasury's have a zero risk weight, while junk bonds have a risk weight of 8 percent. • Multiplying the absolute dollar values of all the long and short positions in these instruments by the specific risk weights produces a total specific risk charge of $229.
V. Regulatory Models: The BIS Standardized Framework • 1. Fixed Income • 1. The specific risk weights:
V. Regulatory Models: The BIS Standardized Framework • 2. The general market risk charges or weights reflect the same modified durations and interest rate shocks for each maturity in the BIS model for total gap exposure. • This results in a general market risk charge of $66.
V. Regulatory Models: The BIS Standardized Framework • Panel A: FI Holdings and Risk Charges • Specific Risk General Market Risk • (1) (2) (3) (4) (5) (6) (7) • Time Band Issuer Position Weight Charge Weight Charge • _________________________________________________________________________ • 0-1 month Treasury $5,000 0.00% $0.00 0.00% $0.00 • 1-3 month Treasury 5,000 0.00 0.00 0.20 10.00 • 3-6 month Qual Corp 4,000 0.25 10.00 0.40 16.00 • 6-12 month Qual Corp (7,500) 1.00 75.00 0.70 (52.50) • 1-2 years Treasury (2,500) 0.00 0.00 1.25 (31.25) • 2-3 years Treasury 2,500 0.00 0.00 1.75 43.75 • 3-4 years Treasury 2,500 0.00 0.00 2.25 56.25 • 3-4 years Qual Corp (2,000) 1.60 32.00 2.25 (45.00) • 4-5 years Treasury 1,500 0.00 0.00 2.75 41.25 • 5-7 years Qual Corp (1,000) 1.60 16.00 3.25 (32.50)
V. Regulatory Models: The BIS Standardized Framework • Panel A: FI Holdings and Risk Charges • Specific Risk General Market Risk • (1) (2) (3) (4) (5) (6) (7) • Time Band Issuer Position Weight Charge Weight Charge • _________________________________________________________________ • 7-10 years Treasury ($1,500) 0.00% $0.00 3.75% ($56.25) • 10-15 years Treasury (1,500) 0.00 0.00 4.50 (67.50) • 10-15 years Non Qual 1,000 8.00 80.00 4.50 45.00 • 15-20 years Treasury 1,500 0.00 0.00 5.25 78.75 • > 20 years Qual corp 1,000 1.60 16.00 6.00 60.00 • _________________________________________________________________ • Specific Risk 229.00 • Residual General Market Risk 66.00
V. Regulatory Models: The BIS Standardized Framework • 3. Offsets or Disallowed Factors: The BIS model assumes that long and short positions, in the same maturity bucket but in different instruments, cannot perfectly offset each other. Thus, this $66 general market risk tends to underestimate interest rate or price risk exposure. • For example, the FI is short 10-15 year U.S. Treasuries with a market risk charge of $67.50 and is long 10-15 year junk bonds with a risk charge of $45. However, because of basis risk--that is, the fact that the rates on Treasuries and junk bonds do not fluctuate exactly together---we cannot assume that a $45 short position in junk bonds is hedging an equivalent ($45) value of U.S. Treasuries of the same maturity.
V. Regulatory Models: The BIS Standardized Framework • Vertical Offsets: • Thus, the BIS requires additional capital charges for basis risk, called vertical offsets or disallowance factors. In our case, we disallow 10 percent of the $45 position in junk bonds in hedging $45 of the long Treasury bond position. This results in an additional capital charge of $4.5.