Download
1 / 104
1.13k likes | 2.88k Views
100 marketing management model, diagrams and charts for powerful business presentations. Content: Market Structure, Market Forces, Marketing Concepts, Customer Added Value, Relationship Marketing, Profitability Analysis, Stakeholder Analysis, Threat Matrix, Value Creation, Marketing Mix, Hierarchy of Needs, Demand Measurement, Market Definition, Segment Rivalry, Target Market, Product Development, Demand-Life-Cycle, Market-Space Diagram, Marketing Strategies, Market Entry, Promotions, Marketing Communication, Service Quality Model, 3 C’s Model, Hybrid Grid, Distribution Management, Consumer Brands, Control Chart Model, Multichannel Marketing, Demand Elasticity, Strategic Planning Gap, AIDA Model /nMore business diagrams to download on http://www.drawpack.com your visual business knowledge

E N D
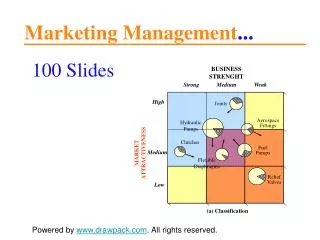
BUSINESS STRENGHT Medium Weak Strong High Joints Aerospace Fittings MARKET ATTRACTIVENESS Hydraulic Pumps Clutches Fuel Pumps Medium Flexible Diaphragms Relief Valves Low (a) Classification Marketing Management... 100 Slides Powered by www.drawpack.com. All rights reserved.
Key Words... Market Structure – Market Forces – Marketing Concepts – Customer Added Value – Relationship Marketing – Profitability Analysis – Stakeholder Analysis – Threat Matrix – Value Creation – Marketing Mix – Hierarchy of Needs – Demand Measurement – Market Definition – Segment Rivalry – Target Market – Product Development – Demand-Life-Cycle – Market-Space Diagram – Marketing Strategies – Market Entry – Promotions – Marketing Communication – Service Quality Model – 3 C’s Model – Hybrid Grid – Distribution Management – Consumer Brands – Control Chart Model – Multichannel Marketing – Demand Elasticity – Strategic Planning Gap – AIDA Model
Resources Resources Resource markets Money Money Taxes, goods Services, money Services, money Taxes Manufacturer markets Government markets Consumer markets Taxes, goods Services Services, money Taxes, goods Money Money Middlemen markets Goods and services Goods and services Markets and Structure of Flow
Environment Suppliers Company (marketer) Marketing intermediaries End user market Competitors Main Actors and Forces in the Market
Starting point Focus Means Ends Selling and promoting Profits through sales volume Factory Products (a) The selling concept Profits through customer satisfaction Customer needs Coordinated marketing Target market (b) The marketing concept The Selling and Marketing Concepts
Customers Front-line people Middle management Top management Customers Customers The Chart Company Organization
Production Finance Production Production Finance Marketing Personnel Personnel Marketing Personnel Marketing Finance (a) Marketing as an equal function (b) Marketing as a more important function (c) Marketing as the major function Production Production Finance Marketing Customer Customer Personnel Personnel Finance Marketing (e) The customer as the controlling function and marketing as the integrative function (d) The customer as the controlling function Marketing`s Role in the Company
Product value Services value Total customer value Personnel value Image value Customer delivered value Monetary price Time cost Total customer cost Energy cost Psychic cost Determinants of Customer Added Value
Firm infrastructure Human resources management Margin Technology development Procurement Margin Inbound logistics Operations Outbound logistics Marketing and sales Service Primary Activities The Generic Value Chain
HIGH MARGIN MEDIUM MARGIN HIGH MARGIN Many customers / distributors Accountable Reactive Basic or reactive Medium number of customers / distributors Accountable Reactive Proactive Few customers / distributors Partnership Proactive Accountable Levels of Relationship Marketing
Customers C1 C2 C3 P1 + + + Highly profitable product P2 + + Profitable product Products P3 _ _ Losing product P4 + _ Mixed-bag product High profit customer Mixed-bag customer Losing customer Customer/Product Profitability Analysis
Planning Implementing Controlling Corporate planning Division planning Business planning Product planning Measuring results Diagnosing results Taking corrective action Organizing Implementing The Strategic Planning, Implementation and Control Process
Stockholder satisfaction Growth Profits Customer satisfaction Higher-quality products and services Continuous improvements Breakthrough innovations Higher-quality environment (employee satisfaction) Relationships Among Stakeholders
Question Marks Stars 22% 20% 18% 16% Market Growth Rate 4 7 Dogs Cash Cows 2 14% 8 3 12% 1 10% 5 8% 6 6% 4% Relative Market Share 2% 10 x 4 x 2 x 1.5 x 1 x 0.5 x 0.4 x 0.3 x 0.2 x 0.1 x The BCG Growth-Share Matrix
BUSINESS STRENGHT Medium Weak Invest / grow Strong 5.00 Joints High Selectivity / earnings Harvest / divest MARKET ATTRACTIVENESS Aerospace Fittings Hydraulic Pumps 3.67 Clutches Fuel Pumps Medium Flexible Diaphragms 2.33 Relief Valves Low (a) Classification 1.00 3.67 2.33 5.00 1.00 Market Attractiveness – Portfolio Classification and Strategies I
BUSINESS STRENGHT Medium Weak Strong • PROTECT POSITION • invest to grow at maximum digestible rate • concentrate effort on maintaining strength • INVEST TO BUILD • challenge for leadership • build selectively on strengths • reinforce vulnerable areas • BUILD SELECTIVELY • specialize around limited strengths • seeks ways to overcome weaknesses • withdraw if indications of sustainable growth are lacking High MARKET ATTRACTIVENESS • BUILD SELECTIVELY • invest heavily in most attractive segments • build up ability to counter competition • emphasize profitability by raising productivity • SELECTIVITY/MANAGE FOR EARNINGS • protect existing program • concentrate investments in segments where profitability is good and risks are relatively low • LIMITED EXPANSION OR HARVEST • look for ways to expand without risk; otherwise, minimize investment and rationalize operations Medium • PROTECT AND REFOCUS • manage for current earnings • concentrate on attractive segments • defend strengths • MANAGE FOR EARNINGS • protect position in most profitable segments • upgrade product line • minimize investment • DIVEST • sell at time that will maximize cash value • cut fixed costs and avoid investment meanwhile Low (b) Strategies Market Attractiveness – Portfolio Classification and Strategies II
Sales Desired sales Diversification growth Strategic-planning gap Integrative growth Intensive growth Projected sales Time (years) 5 0 10 The Strategic-Planning Gap
Current Products New Products Market penetration strategy Product development strategy Current Markets Market development strategy Diversification strategy New Markets Ansoff‘s Product/Market Expansion Grid
External environment analysis Goal formulation Program formulation Strategy formulation Feedback and control Implementation Business mission Internal environment analysis The Business Strategic-Planning Process
Success Probability Opportunities High Low • Company develops a more powerful lighting system 1 2 High • Company develops a device for measuring the energy efficiency of any lighting system Attractiveness • Company develops a device measuring illumination level 4 3 Low • Company develops a software program to teach lighting fundamentals to TV studio personnel Opportunity Matrix
Probability of Occurence High Low Threats • Competitor develops a superior lighting system 1 2 High • Major prolonged economic depression • Higher costs Seriousness • Legislation to reduce number of TV studio licenses 3 4 Low Threat Matrix
Structure Systems Strategy Shared values Skills Style Staff McKinsey 7-S Framework
Make the Product Sell the Product Advertise / promote Sell Distribute Service Design product Procure Make Price (a) Traditional Physical Process Sequence Choose the Value Provide the Value Communicate the Value Distributing Sourcing Customer segmentation Sales promotion Product develop- ment Market selection / focus Value positioning Service develop- ment Advertising Salesforce Pricing Making Servicing (b) The Value Creation and Delivery Sequence Two Views of Creating Value
High quality E A High price Low price B C D Low quality The Product-Positioning Map
Marketing Mix Channels Coverage Assortments Locations Inventory Transport Place Product Product variety Quality Design Features Brand name Packaging Sizes Services Warranties Returns Target Market Low quality Promotion Sales promotion Advertising Salesforce Public relations Direct marketing Price List price Discounts Allowances Payment period Credit terms The Four P‘s of the Marketing Mix
Sales promotion Promotion Mix Advertising Offer Mix Company Products Services Prices Salesforce Distribution channels Target customers Public relations Direct mail and telemarketing Marketing-Mix Strategy
Marketing Intermediaries Demographic/ economic environment Technological / physical environment Marketing information system Marketing planning system Product Publics Price Target customers Suppliers Place Promotion Marketing organization and implementation system Marketing control system Competitors Political / legal environment Socio/ cultural environment Factors Influencing Marketing Strategy
Marketing Information System Marketing Managers Analysis Planning Implemen-tation Control Marketing Environment Target markets Marketing channels Competitors Publics Macroenviron-ment forces Developing Information Assessing information needs Internal records Marketing intelligence Marketing decision support analysis Marketing research Distributing information Marketing decisions and communication The Marketing Information System
Other stimuli Buyer’s decisions Buyer’s characteristics Buyer’s decisions process Marketing stimuli Problem recognition Information search Evaluation Postpurchase behavior Product Price Place Promotion Economic Technological Political Cultural Cultural Social Personal Psychological Product choice Brand choice Dealer choice Purchase timing Purchase amount Model of Buyer Behavior
Cultural Culture Subculture Social class Cultural Reference groups Family Roles and statuses Personal Age and life- cycle stage Occupation Economic circumstances Lifestyle Personality and self-concept Psychological Motivation Perception Learning Beliefs and attitudes BUYER Model of Factors Influencing Behavior
Self-Actualization Needs (self-development and realization) Esteem Needs (self-esteem, recognition, status) Social Needs (sense of belonging, love) Safety Needs (security, protection) Physiological Needs (hunger, thirst) Maslow‘s Hierarchy of Needs
Seek redress directly from business firms Take some form of public action Take legal action to obtain redress Complain to business, private, or governmental agencies Take some action Dissatisfaction occurs Decide to stop buying product or brand or boycott seller Take some form of private action Take no action Warn friends about the product and/or seller How Customers Handle Dissatisfaction
Give it away Rent it To be (re)sold Get rid of it temporarily Trade it Loan it To be used Get rid of it permanently Sell it Direct to consumer Product Use it to serve original purpose Throw it away Through middleman Keep it Convert it to serve a new purpose Store it To middleman Customers‘ Use or Dispose of Product
Basic Conditions Demand Price elasticity Substitutes Rate of growth Cyclical and seasonal character Purchase method Marketing type Supply Raw materials Technology Unionization Product durability Value weight Business attitudes Public policies Industry structure Number of sellers Product differentiation Entry and mobility barriers Exit and shrinkage barriers Cost structures Vertical integration Global reach Conduct Pricing behavior Product strategy and advertising Research and innovation Plant investment Legal tactics Performance Production and allocative efficiency Technological progress Profitability Employment Model of Industrial Organization Analysis
Customer Centered No Yes Product orientation Customer orientation No Competitor Centered Competitor orientation Market orientation Yes Shifting Company Orientations
World U.S.A. Space Level Region Territory Customer All sales Industry sales Company sales Product Level Product line Product form Product item Short-range Medium-range Long-range Time Level 90 Types of Demand Measurement (6 x 5 x 3)
100% 100% Total population Potential market 40% Available market 20% Qualified available market 10% 10% Served market Potential market 5% Penetrated market (a) Total market (b) Potential market Levels of Market Definition
Market Segmentation Market Positioning Market Targeting • Identify possible positioning concepts for each target segment • Select, develop, and communicate the chosen positioning concept • Evaluate the attractiveness of each segment • Select the target segment(s) • Identify segmentation variables and segment the market • Develop profiles of resulting segments Segmentation, Targeting, Positioning
(a) No market segmentation (b) Complete segmentation 2 B 1 A 2B 1A 1 A 3 B 1A 3B B 1 1B A 3 3A (c) Market segmentation by income classes 1, 2, and 3 (d) Market segmentation by age classes A and B (e) Market segmentation by income-age class Different Segmentation of a Market
Creaminess Creaminess Creaminess Sweetness (a) Homogeneous preferences Sweetness (b) Diffused preferences Sweetness (c) Clustered preferences Basic Market-Preference Patterns
Potential Entrants (Threat of mobility) Industry Competitors (Segment rivalry) Buyers (Buyer power) Suppliers (Supplier power) Substitutes (Threat of substitutes) Five Forces Determining Segment Structural Attractiveness
Exit Barriers Low High Low, stable returns Low, risky returns Low Entry Barriers High, stable returns High, risky returns High Barriers of Profitability
M1 M1 M1 M1 M1 M1 M1 M1 M1 P1 P1 P1 P1 P1 P2 P2 P2 P2 P2 P3 P3 P3 P3 P3 Single-segment concentration Market specialization Selective specialization M1 M1 M1 M1 M1 M1 (P=Product / M=Market) Product specialization Full coverage Five Patterns of Target Market Selection
Company Marketing Mix Market (a) Undifferentiated marketing Company marketing mix 1 Segment 1 Company marketing mix 2 Segment 2 Company marketing mix 3 Segment 3 (b) Differentiated marketing Segment 1 Segment 2 Company marketing mix Segment 3 (c) Concentrated marketing Three Alternative Market Selection Strategies
Customer Groups Customer Groups 1 2 3 4 1 2, 3 5 6 7 8 4, 8 Products Products 5, 6, 7 9 10 11 12 9, 10, 11, 12 (a) Segments (b) Supersegments Segments and Supersegments
Small Large Fragmented Specialization Many Number of approaches to achieve advantage Stalemate Volume Few Size of the advantage The New BCG Matrix
Quality improvement Superior Quality maintenance High (Profitability ROI) Quality adulteration Quality Level Average Low Time Quality Level Average Superior Low A) Relationship between product quality and profitability (return on investment – ROI) B) Three strategies for managing product quality through time Brand-Quality Strategies and Profitability
No Is the market opportunity compatible with company objectives? Profit objective Yes No Sales volume objective Yes No Sales growth objective Yes Yes Customer goodwill objective No Is the market opportunity compatible with company resources? Does company have the necessary capital? Can it be obtained at a reasonable cost? No No Yes Yes Does company have the necessary production and marketing know-how? Can it be obtained at a reasonable cost? No No Yes Yes Does company have the necessary distribution capability? Can it be obtained at a reasonable cost? No No Yes Yes Reject the market opportunity Move to next stage Evaluating a Market Opportunity
High price per ounce Brand A Bacon and eggs Brand C Cold cereal High in calories Slow Low in calories Quick Pancakes Low Brand B Instant breakfast Hot cereal Low price per ounce Inexpensive • Product-positioning map (breakfast market) • Brand-positioning map (instant breakfast market) Product and Brand Positioning
Coordinate, stimulate, and search for ideas in external environment and among company personnel • Identify: • Company factors • Their weights Develop alternative product concepts • Propose: • Price • Distribution • Promotion • Prepare: • Market analysis • Cost analysis Go into limited production, prepare advertising Buy equipment and go into full production and distribution • Conduct: • Engineering tests • Consumer preference tests • Branding • Packaging Yes Yes Yes Yes Yes Yes Yes Yes Lay future plans 1. Idea generation Is the particular idea worth considering? 2. Idea screening Is the product idea compatible with company objectives, strategies, and resources? 3. Concept developing and testing Can we find a good concept for the product that consumers say they would try? 4. Marketing strategy development Can we find a cost-effective, affordable marketing strategy? 5. Business analysis Will this product meet our profit goal? 6. Product development Have we developed a product that is sound technically and commercially? 7. Market testing Have product sales met our expectations? 8. Commercialization Are product sales meeting our expectations? No No Yes Should we send the idea back for product development? Would it help to modify our product or marketing program? Yes No No No No No No DROP The New-Product-Development Decision Process