Download

1 / 20
230 likes | 517 Views
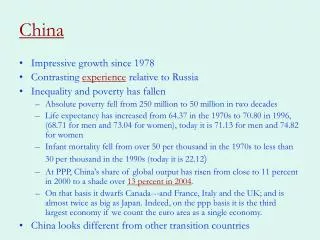
Relationship between growth, inequality and poverty and pro-poor growth in Thailand: 1986 – 2011. Chaleampong Kongcharoen Faculty of Economics, Thammasat University 14 August 2014. Motivation. Thailand economic development in past three decades results in rapid growth in income per capita.

E N D
Relationship between growth, inequality and poverty and pro-poor growth in Thailand: 1986 – 2011 ChaleampongKongcharoen Faculty of Economics, Thammasat University 14 August 2014
Motivation • Thailand economic development in past three decades results in rapid growth in income per capita. • An income distribution hardly changed over the period. • Pro-poor growth may be referred as growth that benefits the poor. [Kakwani and others (2004)] • The World Bank’s definition of pro-poor growth is weak.
Objective • Examine the effect of economic growth on poverty and income distribution in Thailand both in overall country and by region. • The question is “whether the poor benefit from the rapid growth, i.e., is the growth pro-poor?” • We further investigate the relationship between income growth, poverty and income inequality in Thailand over last three decades.
Methodology • Poverty and Income Inequality Measures • Poverty measures • Headcount Index – the ratio of the poor to the total population • Poverty Gap Index – the difference between the poor’s income and poverty line • Squared Poverty Gap Index or Poverty Severity
Methodology • Poverty and Income Inequality Measures • Income Inequality Measures • Gini coefficient • Poverty Reduction Decomposition • Datt and Ravallion (1992) Decomposition - the change in poverty can be decomposed into growth-driven and redistribution-driven components. • Shapley Value Decomposition Approach
Methodology • Pro-poor Growth Index • Absolute Measures • Growth Incidence Curve • Rate of Pro-Poor Growth
Data • Uses the Socio-Economic Survey (SES) from year 1986 to 2011. • The poverty line data is from the National Economic and Economic and Social Development Board (NESDB).
Poverty and Income Inequality in Thailand, 1986 - 2011 Figure 2: Headcount Index • สัดส่วนคนจนลดลงจาก 62% ในปี 1986 เหลือ 15% ในปี 2011 • ตัวชี้วัดอื่นๆแสดงให้เห็นว่าสถานการณ์ความยากจนของไทยดีขึ้น
Poverty and Income Inequality in Thailand, 1986 - 2011 Figure 4: Poverty Gap by Regions Figure 3: Headcount Index by Regions • เมื่อพิจารณาแยกภูมิภาค แนวโน้มของตัวชี้วัดความยากจนมีทิศทางดีขึ้น • ความแตกต่างระหว่างภูมิภาค โดยภาคเหนือและภาคตะวันออกเฉียงเหนือมีสัดส่วนคนจนสูง
Poverty and Income Inequality in Thailand, 1986 - 2011 Figure 5: Gini Coefficient and Headcount Index, whole kingdom, 1986 – 2011 ช่วงระหว่างปี 1986 ถึง 2011 ค่าสัมประสิทธิ์จินี่ของประเทศไม่ได้มีความแตกต่างอย่างมีนัยสำคัญทางสถิติ
Poverty and Income Inequality in Thailand, 1986 - 2011 Figure6: Gini coefficient by Regions, 1986 – 2011 • เมื่อพิจารณาแยกตามภูมิภาค • ภาคกลางมีแนวโน้มดีขึ้น • ในขณะที่กรุงเทพมีการกระจายรายได้ที่ไม่เท่าเทียมกันมากขึ้น
Poverty Decomposition • ช่วงระหว่างปี 1986 ถึง 1996 สัดส่วนคนยากจนลดลง 23.5% โดยเป็นผลจากการเจริญเติบโต 25% ในขณะที่การกระจายรายได้ที่แย่ลงส่งผลเพิ่มสัดส่วนคนจน • ช่วงปี 2006 ถึง 2011 การลดความยากจนมาจากปัจจัยทั้งสองเท่าๆกัน
Poverty Decomposition, by Regions • เมื่อพิจารณาแยกตามภูมิภาค ปัจจัยด้านการเจริญเติบโตยังเป็นปัจจัยหลักในการลดความยากจนของไทย
Pro-poor Growth • ระหว่างปี 1986 ถึง 2011 ค่าเฉลี่ยของรายได้ครัวเรือนเพิ่มขึ้น 215% ในขณะที่รายได้ของคนจนเพิ่มขึ้นเพียงแค่ 72% • เมื่อพิจารณาดัชนีของ Kakwani and Parniaพบว่า PPGI จาก headcount index มีค่าเท่ากับ 1.11 แสดงว่าการเจริญเติบโตมีลักษณะ pro-poor
Pro-poor Growth เมื่อพิจารณาแยกเป็นรายภูมิภาคพบว่า PPGI > 1 สำหรับทุกภูมิภาคยกเว้นกรุงเทพ
Relationship among Growth, Poverty and Income Distribution • ใช้ข้อมูล panel data โดยที่ให้ภูมิภาคเป็น cross-sectional unit • พบความสัมพันธ์เชิงผกผันระหว่างรายได้เฉลี่ยกับความยากจนแต่รายได้ไม่ได้มีความสัมพันธ์อย่างมีนัยสำคัญทางสถิติกับการกระจายรายได้ • ความสัมพันธ์เชิงบวกระหว่าง GINI กับตัวชี้วัดความยากจน
Conclusion • Poverty measures have been improved over time corresponding with the economic growth. • Income distribution hardly changed over the period. • The growth is pro-poor for every region except Bangkok. • The estimation results show that there is the negative relationship between income and poverty but no relationship with income inequality.