Poverty: Facts, Causes and Consequences
Poverty: Facts, Causes and Consequences Hilary Hoynes University of California, Davis California Symposium on Poverty October 2009 In 2008, more than 1 in 6 children lived in poverty and 13.2 percent of all persons were poor. These numbers are expected to be higher in 2009.


Poverty: Facts, Causes and Consequences
E N D
Presentation Transcript
Poverty: Facts, Causes and Consequences Hilary Hoynes University of California, Davis California Symposium on Poverty October 2009
In 2008, more than 1 in 6 children lived in poverty and 13.2 percent of all persons were poor. • These numbers are expected to be higher in 2009. • Government spending on anti-poverty programs in 2008 included $25 b. on TANF, $50 b. on the EITC, and $38 b. on Food Stamps. • In this talk, I discuss what we know about the causes of poverty and its consequences for children and families.
Outline • How do we define poverty? • Facts: Poverty in the U.S. and in California • Impacts of poverty on children and families • Causes and how government programs can help
How do we define poverty? • Facts: Poverty in the U.S. and in California • Impacts of poverty on children and families • Causes and how government programs can help
What is the Official Poverty Measure? • A family is poor if their family income is less than the federal poverty threshold • Poverty lines vary by family size and are adjusted for changes in prices each year • Based on the cost of food in the 1960s (mult by 3) • Poverty is a family concept—all persons in the same family have the same poverty status By comparison, 2008 median family income was $52,000.
Concerns about official poverty measure • Income measure is pre-tax family income; includes only cash income • Does not include Food Stamps or Earned Income Tax Credit • Not adjusted for work-related expenses • Not adjusted for regional variation in costs of living (e.g., housing) • Definition of poverty has not changed since measure developed in early 1960s • There are no easy solutions. In this presentation, I use the official measure
How do we define poverty? • Facts: Poverty in the U.S. and in California • Impacts of poverty on children and families • Causes and how government programs can help
Poverty in California • Poverty rates across groups in California mirror the patterns shown for the U.S. as a whole. • There are important things to point out for California
In recent years, poverty rates have been higher in California
How do we define poverty? • Facts: Poverty in the U.S. and in California • Impacts of poverty on children and families • Causes and how government programs can help
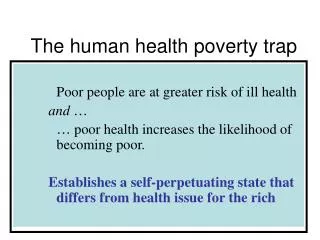
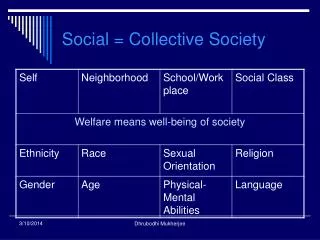
Poverty is measured and watched by virtually all developed countries. • It is an important indicator of economic well-being • In the U.S., poverty is associated with many adverse outcomes
Children who grow up poor are more likely to • Not attend preschool • Perform worse in school • Drop out of high school, have lower educational attainment • (Girls) Have a teen birth • (Boys) Be incarcerated • Live in poverty as adults • Have worse health and shorter life expectancy Caution: It is difficult to know the role played by poverty in these correlations. There are many other factors involved.
How do we define poverty? • Facts: Poverty in the U.S. and in California • Impacts of poverty on children and families • Causes and how government programs can help
(1) The Labor Market • As we saw, most poor families contain workers • Poverty is very closely tied to the conditions of the labor market • Availability of jobs • Wages paid at those jobs
Poverty increased more in states that experienced larger increases in unemployment Changes from 2000 to 2008
Poverty increased more in states that experienced larger increases in unemployment CA is here
Wages for less skilled men have been falling since the early 1970s Source: Autor, Katz and Kearney (2008)
No growth in family income at the bottom of the distribution (and significant growth at the top) Source: Debbie Reed, PPIC
KEY: These figures show that economic growth does not guarantee reductions in poverty
The Earned Income Tax Credit • Refundable tax credit for working, low-income taxpayers with children (single and married) • [Much smaller credit for childless] • No credit if no family earnings • EITC acts to supplement earnings. • Maximum credit for 2009: • $3043 for one-child families • $5028 for families with two or more children • Total cost in 2008 of the EITC is $40 b. compared to $25 b. for TANF and $38 b. for food stamps.
KEY: Maximum EITC credit helps families near poverty threshold!
How the EITC reduces poverty • Key design feature of EITC (and what distinguishes it from traditional income support programs) is that eligibility requires earned income. • The EITC transfers income to low income families with children WHILE encouraging work. • The generosity of the EITC increased substantially with tax reforms in 1986, 1990, and 1993.
So, the EITC has the potential to increase incomes and reduce poverty through two channels: • The EITC represents an increase in income for the family • The EITC provides incentives to enter work, and thus increase earnings which increases family income.
BUT … the success of the EITC is not measured by official poverty statistics • Remember our definition of poverty? • Poverty is based on PRE-TAX family income • EITC operates through the tax system
(3) Government Assistance: Why U.S. cash welfare programs are unlikely to affect poverty
Cash Welfare Programs (TANF) Income support (welfare) programs are unlikely to affect poverty rates for two reasons: • Benefit levels are low, unlikely to increase a household’s income over the poverty line. • Benefits are targeted on those out of work; thereby discouraging work rather than encouraging it. [This does not mean the program is not important or useful. Rather that it simply should not affect poverty rates.]
One could use TANF to reduce poverty, but funding would have to be about four times the current funding
What we do know, however, is that the combination of welfare reform and the expansion of the EITC led to large increases in employment among female-headed families in the late 1990s. • These increases in employment have the potential to reduce poverty.
Percent of Women Working (by Marital Status and Children) On the eve of welfare reform and EITC increases, much attention is given to the low employment rates of single mothers.
Percent of Women Working (by Marital Status and Children) Beginning in 1992—dramatic increases in employment for single mothers, with little change for other women
Expansion of EITC and Welfare Reform has Radically Changed the Landscape for Low Income Families with Children