Download
1 / 42
430 likes | 588 Views
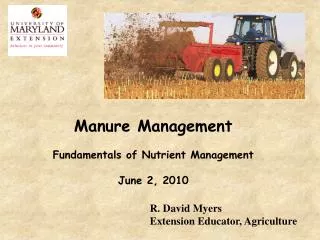
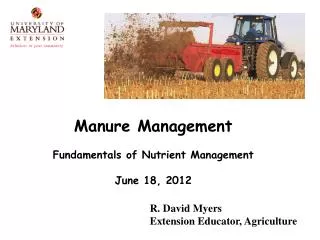
Manure Management Fundamentals of Nutrient Management June 18, 2012. R. David Myers Extension Educator, Agriculture. Fertilizer Options?. Legumes. Manure. Commercial Fertilizer. Bio-Solids.

E N D
Manure Management Fundamentals of Nutrient Management June 18, 2012 R. David Myers Extension Educator, Agriculture
Fertilizer Options? Legumes Manure Commercial Fertilizer Bio-Solids
Nutrient Managementhttp://www.agnr.umd.edu/users/waterqual/themes/nutrient_management/manmh2006.htm
Introduction • Manure is an unavoidable byproduct of animal production. • Properly managed - Manure can be a valuable source of nutrients for crop production. • Improper Management – • Environmental degradation, • Damage to crops, and • Conflicts with neighbors and the public because of odors, pests, or other nuisances. Bob Nichols, USDA-NRCS • Proper management considers all aspects of the operation: • How and where manure is generated. • How it is stored. • How it is ultimately used.
Manure production by species • The quantity of manure produced varies considerably: • Amongspecies: because of differences in animal diets and metabolism. • Within species: due primarily to differences in management. Animals per AUa Annual manure production per AU -1000 lbs- ---tons--- Beef cattle 1.00 11.50 Dairy cattle 0.74 15.24 Swine (breeders) 2.67 6.11 Swine (other) 9.09 14.69 Hens (laying) 250.00 11.45 Pullets (over 3 months) 250.00 8.32 Pullets (under 3 months) 455.00 8.32 Broilers 455.00 14.97 Turkey (slaughter) 67.00 8.18 aAU = animal unit From Tetra Tech, Inc., 2004.Technical fundamentals of CAFOs for permit writers and inspectors. Tetra Tech, Pasadena, CA. • Calculating the Volume of Animal Manure Produced in an Agricultural Operation.
Factors that Cause Variation in the Plant Nutrient Levels in Manure Beef/Dairy/Poultry/Swine Manure UMD-AGNR Photo Archive; http://www.photos.umd.edu
Manure nutrient content variation by species • Animals are relatively inefficient in their utilization of N, P, and K from feed, with more than 50% commonly passing through to the feces. These nutrients may end up in the manure and, in the case of N, be lost to the atmosphere. • The amount and type of bedding (if any) will also influence the nutrient content of the material. • Nutrient quantity in the manure varies considerably by species. For example, broiler litter may contain six times as much N, and ten times as much P, as horse manure. Manure Type N (total) P (P2O5) K (K2O) ----------------lb / ton ---------------- Broiler litterb 59 63 40 Turkey (fresh)a 27 25 12 Layera 35 42 28 Horseb 9 6 11 -------------lb / 1000 gal ------------- Swineb 40 37 23 Dairyb 28 19 25 afrom Zublena, J.P., J.C. Barker, and T.A. Carter. 1990. Soil facts: Poultry manure as a fertilizer source. North Carolina Extension Service Pub. AG-439-5. b from Bandel, V.A. 1990. Using manure to cut fertilizer costs. University of Maryland Cooperative Extension Service Fact Sheet 512.
Manure sampling • Actual manure nutrient content can be dramatically different from typical values. • Testing of manure from specific operations is necessary to: • Accurately assess nutrient concentrations • Calculate manure application rates to supply crop nutrient needs. • A manure sample must be collected for laboratory analysis in order to determine the exact nutrient content. • Proper collection of this sample is critical to ensure that it accurately represents the manure to be used. • Manure samples should be either refrigerated or sent immediately to the testing laboratory. • In practice, it is difficult to obtain a truly representative sample because of the inherent variability in manure within a stockpile, a lagoon, or other storage facility. • Note:Guidelines were adapted from those given in: R.E. Hermanson. 1996. Manure sampling for nutrient analysis with worksheets for calculating fertilizer values. Washington State Cooperative Extension Bulletin EB1819.
Manure sampling • Sampling semi-solid lot manure: • Scraped directly from lot into spreader: • Collect about 2 lbs of manure using nonmetallic collectors from different locations within a loaded spreader. • From storage: • Collect manure using nonmetallic collectors from under the surface crust while avoiding bedding materials. Dairy manure storage (photo by Katherine Gugulis, USDA-NRCS)
Manure sampling • Sampling liquid manure slurry: • From under slotted-floor pit: a) Extend a 1/2-in nonmetallic conduit open on both ends into manure to pit floor.b) Seal upper end of conduit by placing a thumb over open end to trap manure, remove and empty slurry into nonmetallic container. c) Take subsamples totaling at least 1 quart from 5 or more locations. • From exterior storage basin or tank: a) Ensure that manure has been well mixed with a liquid manure chopper-agitator pump or propeller agitator.b) Take subsamples from 5 pit locations from agitator pump or from manure spreader, and place in non-metallic container. Sampling manure from slotted-floor pit (photo by Bob Nichols, USDA-NRCS)
Manure sampling • Sampling lagoon liquid: • Recycled liquid: • Collect recycled lagoon liquid from inflow pipe to flush tanks in a nonmetallic sample container. • From lagoon: • a) Place a small bottle (1/2 pint or less) on end of 10 to 15 ft pole.b) Extend bottle 10 to 15 ft from bank edge.c) Brush away floating scum or debris.d) Submerge bottle within 1 ft of liquid surface.e) Empty into a plastic bucket, repeat 5 times around lagoon, and mix. Manure lagoon (photo by Bob Nichols, USDA-NRCS)
Manure sampling • Sampling broiler or turkey litter: • House litter: • a) Visually inspect litter for areas of varying quality (e.g., areas around feeders and waterers), and estimate percent of floor surface in each area.b) Take 5 litter subsamples at representative locations representative of overall litter characteristics.c) At each location, collect litter from a 6-in by 6-in area to earth floor and place in a plastic bucket.d) Mix the 5 subsamples in the bucket, transfer to a nonmetallic sample container, and seal. • From stockpile: • a) Collect subsamples from 5 locations at least 18 in into pile.b) Mix, transfer 2 to 3 lbs to nonmetallic sample container, and seal. Collecting litter sample (photo by Bob Nichols, USDA-NRCS)
Land application of manure • Most manure generated in the Mid-Atlantic region is applied to land as a nutrient source for crop production.Manure also improves certain soil properties, including soil structure, water-holding capacity, and populations of beneficial organisms. • It is critical both from crop production and environmental perspectives that the application rates: • 1. Provide adequate nutrient levels. • 2. Avoid the application of excess nutrients that can leave the field via runoff or leaching. Overapplication of manure has been linked to environmental problems, including eutrophication. Spreading poultry manure (photo by Bob Nichols, USDA-NRCS)
Land application of manure: Nutrient availability • Manure is usually managed to provide the three major plant nutrients: N, P, and K. • The goal of proper manure management for crop production is to apply the manure using appropriate methods and rates to maximize the amount of land-applied nutrients that are taken up by plants. • Determining the availability of P and K is a relatively simple matter of determining the P and K content of the manure. • Plant availability of the P and K in manure is commonly assumed to be similar to the availability of these nutrients in commercial fertilizer because most of the P and K in land-applied manure are present in inorganic forms. • Determining the availability of N in manure is more complicated.
Other nutrients in manure (poultry) Typical concentrations of secondary and micro-nutrients in various poultry manures. Secondary and micro-nutrients enhance the value of manure as a balanced nutrient source. From Zublena, J.P., J.C. Barker, and T.A. Carter. 1990. Soil facts: Poultry manure as a fertilizer source. North Carolina Extension Service Pub. AG-439-5.
Other nutrients in manure (swine) Typical concentrations of secondary and micro-nutrients in various swine manures. From Zublena, J.P., J.C. Barker, and T.A. Carter. 1990. Soil facts: Poultry manure as a fertilizer source. North Carolina Extension Service Pub. AG-439-5.
Storage and Handling May Cause Significant Nutrient Loss Especially Nitrogen
Manure storage and handling: Nutrient loss • The table shows typical manure nutrient losses during handling and storage. • Losses were calculated by subtracting the nutrient contents after storage from “as-excreted” values so they include both storage and handling losses. Handling losses likely account for a consistent, but small, amount of nutrient loss. From Fulhage, C.D., and D.L. Pfost. 2002. Fertilizer nutrients in livestock and poultry manure. University of Missouri Cooperative Extension Bulletin EQ351.
Manure storage and handling: Nutrient loss • Changes in manure nutrient content can occur due to: • Dilution (rainwater entering a liquid storage system). • Settling (phosphorus precipitation and accumulation in lagoon sludge). • Gaseous loss (nitrogen volatilization). • Except for lagoons - Losses of P and K during storage are relatively low and are likely due more to handling than actual storage. • Large P and K losses occur in lagoon systems as solids settle from the slurry to the bottom of the lagoon. • By contrast - N losses during storage can range from 15% to as much as 90%. • Nutrient losses during storage are commonly estimated with the use of a standard loss factor for each type of storage.
Manure storage and handling: Nutrient loss Part 1 of table for estimating annual nutrient availability after losses from different kinds of storage. Enter total manure nutrients produced (see example) and multiply by the relevant factor for your storage or management system. Factor is the percentage of nutrients retained.
Manure storage and handling: Nutrient loss Part 2 of table for estimating annual nutrient availability after losses from different kinds of storage.
Lowering manure P content • Cereal grains (such as corn and soybeans) are major feed ingredients in poultry and swine diets. Approximately two-thirds of the P in these grains is in the form phytic acid, or phytate, that is poorly digested by non-ruminants. • This results in inefficient use of most of the grain-P, which subsequently passes through the animal in the manure. • Because of this poor utilization, non-ruminant diets commonly are supplemented with more digestible forms of P, such as calcium phosphate. • One technique to increase the digestibility of P in feed grains is to add phytase to the feed. • Phytase is an enzyme that helps poultry and swine utilize more of the “indigestible” P - Reduces the need for supplemental P. • Research has shown reductions in P excretions of 25 to 50% when phytase is added to poultry or swine diets and calcium phosphate is reduced.
Nitrogen forms in manure • Nitrogen in manures is found in: • Organic N: the fraction in dead plant and animal material and is found primarily inamine groups (-NH2) and uric acid. • Inorganic N: • ammonium (NH4+) • nitrate (NO3-) The most common form of inorganic N in manure isammonium. Partial N cycle showing the forms and transformations of nitrogen in manure.
N mineralization factors • Researchershave adopted some general mineralization factors that are used to estimate N availability for various types of manure during the season following the application. These factors represent the percentages of the organic fraction that are expected to become available to plants during the first year after application of manure. Note: The figures below are for example only - please use the factors for your state. Manure type Spring or early fall applieda Winter topdress or spring residualb Perennial grass ----- N mineralization factor ----- Dairy or beef 0.35 0.20/0.15 0.35 Swine 0.50 0.25/0.25 0.50 Poultry 0.60 0.30/0.30 0.60 a Factors for manure applied in spring for summer annual crops or in early fall for small grain crops. b Factors for manure applied in early winter/available in spring.(From Virginia Department of Conservation and Recreation. 2005. Virginia nutrient management standards and criteria. VA DCR, Richmond, VA.)
Availability of N in manure Manure type Organic N Inorganic N (NH4+) • The inorganic N fraction (approximately 20 to 65% of total N in manure) is considered immediately available to plants. • The organic N fraction must be converted to inorganic N (through mineralization) to become plant-available. • Mineralization rate of organic N is highly variable and influenced by factors such as temperature, moisture, and C:N ratio of the manure. ------------------- % ------------------- Dry poultry 77 23 Liquid poultry 36 64 Semi-solid dairy 70 30 Liquid dairy 58 42 Semi-solid beef 80 20 Swine lagoon 47 53 Mixed swine 35 65 Average percentage of forms of nitrogen in different types of manureFrom Virginia Department of Conservation and Recreation. 1993. Nutrient management handbook. 2nd edition. VA DCR, Richmond, VA.
Using a Laboratory Manure Analysis, Calculate the Plant Available Nitrogen (PAN). Calculating plant-available N (PAN) PAN Plant-Available Nitrogen • The amount of nitrogen available to crops during the first year following application of manure is referred to as plant-available nitrogen, or PAN. • PAN is the sum of: • Total inorganic nitrogen (primarily ammonium, or NH4+-N) + • The percentage of the organic nitrogen that will mineralize during the growing season.
N volatilization in manure • Volatilization is the loss of N as ammonia gas (NH3). • There are two major pathways for this loss in agriculture: • Conversion of ammonium-N (NH4+-N) to ammonia-NH3. • Conversion of urea (CO(NH2)2) to ammonia-NH3. • Urea is a nitrogen-containing compound that is readily converted to ammonia upon catalysis by the ubiquitous enzyme urease: CO(NH2)2 + H2O + urease 2NH3 +CO2
Effect of application method on volatilization The best way to minimize N volatilization losses from applications of manure is incorporation. The table below shows factors that can be used to predict ammonium availability and/or losses of ammonia under different application scenarios. Note: The figures below are for example only - please use the factors for your state. Application method Semi-solid manure Liquid slurry Lagoon liquid Dry litter --------- N availability factor ---------- Injection ----- 0.95 0.95 ----- Broadcast with immediate incorporation 0.75 0.75 0.90 0.90 Incorporated after 2 days 0.65 0.65 0.80 0.80 Incorporated after 4 days 0.40 0.40 0.60 0.65 Incorporated after 7 days or never incorporated 0.25 0.25 0.45 0.50 Irrigation without incorporation ----- 0.20 0.50 ----- From Virginia Department of Conservation and Recreation. 2005. Virginia nutrient management standards and criteria. VA DCR, Richmond, VA.
Ammonia conservation factors for liquid manures and organic residuals (<10% dry matter,>90% moisture)
Ammonium conservation factors for solid manures and organic residuals(>10% dry matter,<90% moisture)
Using a Laboratory Manure Analysis, Calculate the Manure Application Rate Required to Meet a Specified Nutrient Requirement
Calibrating manure application equipment • Proper calibration of manure application equipment is a critical part of manure and nutrient management. • Manure application equipment can be calibrated in one of three basic ways: • The tarp method: Place a tarp flat on the field, spread manure on the tarp, weigh the manure, and calculate the application rate. Repeat measurement at least 3 times. • The swath and distance method: Determine the swath width and distance traveled to empty the spreader and calculate the rate based on area covered and the weight of the load. Repeat measurement at least three times. • The loads-per-field method: Simply count the number of loads of manure applied and divide by the numbers of acres. • For each of the calibration methods, it is critical that all of the controllable variables (i.e., equipment speed, gate settings, type and consistency of manure) remain constant!
Calibrating with the tarp method • The tarp method consists of: 1. Placing a tarp (or plastic sheet) on the ground. 2. Using the manure spreader to spread the manure on the tarp. 3. Weighing the collected manure. 4. Determining the application rate from the weight of the manure collected and the area of the plastic sheet or tarp used. • This measurement should be repeated at least three times and the results averaged to ensure a consistent application rate. Calibrating a manure spreader using the tarp method (photo by Bob Nichols, USDA-NRCS)
Calibrating with the tarp method Conversion factors to calculate the application rate based on the quantity of manure collected and four common tarp sizes. Pounds (lbs) of waste ----------------------Tarp dimensions----------------------- 6 by 6 ft 8 by 8 ft 10 by 10 ft 10 by 12 ft -------------------Application rate (T/A) ------------------- 1 0.61 0.34 0.22 0.18 3 1.82 1.02 0.65 0.54 4 2.42 1.36 0.87 0.73 5 3.03 1.70 1.09 0.91 10 6.05 3.40 2.18 1.82 15 9.08 5.10 3.27 2.72 20 12.10 6.81 4.36 3.63 From Mancl, K. 1996. Land application of waste, spreading and injection. Ohio State University Extension Fact Sheet AEX-707-91.
Calibrating with the tarp method • The rate can also calculated by: • Dividing the number of pounds of manure collected by the area (in square feet) of the tarp. • The result will be the pounds of manure per square foot. • This number can be multiplied by 21.78 to give the tons per acre. • Example: • You have an 8 ft by 8 ft tarp and you collect 8.8 lbs of manure on the tarp. • The calculation would be: Weighing manure collected with tarp method (photo by Bob Nichols, USDA-NRCS) 8.8 lbs / 64 sq ft (8 ft * 8 ft = 64 sq ft) = 0.1375 lbs/sq ft 0.1375 lbs/sq ft * 21.78 = 3 tons/acre applied
Calibrating with the swath and distance method • Calculations for determining application rate for the swath and distance method are similar to those used for the tarp method above. • 1. Determine the weight of a “load” of manure either • by direct measurement (i.e., weighing). • by converting from volume measurement (many applicators are rated by bushel or cubic foot capacity). • 2. Determine the width of the application swath and the distance required to apply the load. From this point, the calculations are identical to those for the tarp method. • Example: • You have a spreader that holds 7000 lbs of manure (3.5 tons). • Your application width is 35 ft and the equipment travels 1200 feet along a field to empty the load. • The calculation would be: • 7000 lbs / 42,000 sq ft (35 ft * 1200 ft = 42,000 sq ft) = 0.1667 lbs/sq ft • 0.1667 lbs/sq ft * 21.78 = 3.63 tons/acre applied
Calibrating with the loads-per-field method • The loads-per-field method is the easiest to calculate: • Determine the weight in tons of a load of manure. • Determine the size of the field in acres. • Count the number of loads applied to the field. • Multiply that number by the weight in tons of a single load. • Divide that number by the acreage of the field. • Example: • You have a spreader that holds 7000 lbs of manure (3.5 tons). • Your field is 55 acres and you apply 35 loads to the field. • The calculation would be: • 35 loads * 3.5 tons/load = 122.5 tons • 122.5 tons / 55 acres = 2.23 tons/acre applied
Calibrating with the loads-per-field method • Major drawback of the loads-per-field method is that it is an “after the fact” calculation so that the applicator does not have the opportunity to make adjustments in the application rate for the particular field. • May best be used as a method of monitoring application rates during the clean-out of a storage facility, using the first two methods described to actually calibrate the spreader before the full scale application of manure begins. Loading manure into spreader (photo by Bob Nichols, USDA-NRCS)
R. David Myers Extension Educator myersrd@umd.edu www.annearundel.umd.edu Thank You! Any Questions?