Download
1 / 20
200 likes | 374 Views
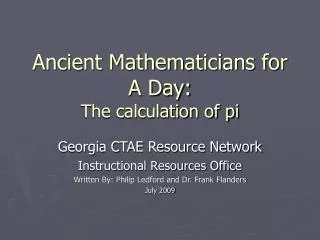
Ancient Mathematicians for A Day: The calculation of pi. Georgia CTAE Resource Network Instructional Resources Office Written By: Philip Ledford and Dr. Frank Flanders July 2009. Objectives. Learn the origin of pi. Examine the process in which pi was developed.

E N D
Ancient Mathematicians for A Day:The calculation of pi Georgia CTAE Resource Network Instructional Resources Office Written By: Philip Ledford and Dr. Frank Flanders July 2009
Objectives • Learn the origin of pi. • Examine the process in which pi was developed. • Test the process in which pi was developed. • Create graphs from discovered data. • Evaluate and compare discovered data. • Solve basic mathematical problems with discovered data.
Introduction to the Activity • Around 4000 years ago the ancient Egyptians and Babylonians discovered the mathematical mystery of pi. They did this by drawing different sized circles and measuring the circumference and the diameter of the circle. They would determine how many diameter lengths it took to equal the length of the circumference. This process gave a number, a ratio, that was consistent for every circle. This number is now known as pi. • This activity will simulate the work of ancient mathematicians and help in understanding pi.
Ancient Mathematicians for A Day • Ever wondered where some of the math problems you do come from? • A lot of the math we deal with today was developed and used over 4000 years ago by ancient civilizations. • One of the biggest mysteries of math is “pi”. • Pi was discovered by the ancient Egyptians and Babylonians.
Pi • Pi is a mathematical constant whose value is the ratio of any circle's circumference to its diameter • In this lesson we will participate in the same procedures the ancient Egyptian and Babylonian mathematicians did to discover pi.
Materials You Will Need • Materials • Paper • Various sizes of circles to outline (Use anything that is circular like cups, cans, etc.) • String • Ruler • Tape • Scissors • Work in groups of two or more.
Instructions • Step One: Tracing… • Trace different size circular objects. • When Drawing…. Remember to trace the best circle you can, the more accurate your drawings are the more accurate your calculations will be.
Instructions (con’t) • Step Two: Taping…. • Tape the string down over the outline of the circles. Remember to try and cover the outline precisely for accuracy. • Cut the string to form a perfect circle.
Instructions (con’t) • Step Three: Measuring Circumference… • After taping the string around the circle outline take it off and measure it. • Record this data as your circumference
Instructions (con’t) • Step Four: Cutting and Folding… • Take the string off the circle. Cut out the circle on the paper. Now fold the paper circle in half.
Instructions (con’t) • Step Five: Measuring Diameter…. • The circle is folded straight through the middle to determine the diameter. • Take a piece of string and lay it out across the folded line. Now cut the string and measure it. This will give you the length of your diameter.
Instructions (con’t) • Step Six: Data…. • Every circle should have a diameter and a circumference measured, and recorded.
Instructions (con’t) • Step Seven: The Fun Part…. • This step is where the ancient mathematicians developed pi. • If the diameter string of a circle is laid on the outline of its circumference it should take the diameter string a little more than three times to equal the circumference. This number is the value of pi and should work with every size circle. • Repeat the previous steps on different sizes of circles. It is recommended to do at least 4 different sizes.
Records • Examine the data that has been recorded. 4 different diameters and 4 different circumference should be written down. • Label a piece of paper in the same manner as the picture below. • Put the diameter under the X-AXIS and circumference under Y-AXIS. • Make sure the data being recorded is for the correct circle. Both diameter and circumference for the first circle traced and measured is recorded on the first circle line.
Graphing Data • Once diameter and circumference from all circles is gathered, draw a graph similar to the one below. • Now it is time to plot points on this graph.
Graphing Data (con’t) • Diameter measurements go on the X-AXIS and circumference measurements go on the Y-AXIS. It is important to plotting these points correctly or your end result will come out wrong. • You should have a graph similar to the one below. Notice that your graph will not look exactly like the on below. • When connecting the points on your graph it should make a straight line.
Testing the Data • To test the data recorded we are going to use a simple formula for slope. • Plug in any two points that have been graphed into this formula.
Testing the Data • Example: Point 1 ->(5.8 , 18.2) and Point 2 -> (2.16 , 6.8) are my points. • I plug the points into the formula6.8 – 18.2 -11.4 _________________ = _____ = 3.13186 ~ 3.142.16 – 5.8 -3.64 Plug the “y” values in first and subtract. Plug the “x” values in next and subtract. You should come out with a fraction like the one above. Divided the numerator from the denominator. This number will equal the slope and it should be close to around 3.14 (pi)
Testing the Data • Any point that has been plotted on the graph can be used to find slope. It does not matter which two are chosen. • If the slope does not come out to be close to 3.14 (pi) look back at the formula make sure the y’s are the numerator and the x’s are the denominators.
Summary • What have we learned? • Pi was developed over 4000 years ago by ancient Egyptians and Babylonians. • We experienced the measurement of pi the way the ancient Egyptians and Babylonians did. • We learned how to collect data by measuring and recording the circumference and diameter of different circles. • We learned ways to calculate pi. • We learned how to graph the data we collected.