Download
1 / 2
20 likes | 94 Views
Explore the impact of BMI on gender-associated differences in overall metabolic profiles of young adults. Analyze metabolites in plasma and serum to identify biomarker candidates with suitable characteristics for future research.

E N D
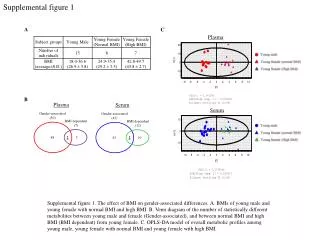
Supplemental figure 1 A C Plasma B Plasma Serum Serum Gender-associated (50) Gender-associated (45) BMI dependent (7) BMI dependent (12) 2 5 48 2 10 43 Supplemental figure 1. The effect of BMI on gender-associated differences. A. BMIs of young male and young female with normal BMI and high BMI. B. Venn diagram of the number of statistically different metabolites between young male and female (Gender-associated), and between normal BMI and high BMI (BMI dependent)from young female. C. OPLS-DA model of overall metabolic profiles among young male, young female with normal BMI and young female with high BMI.
Supplemental figure 2 A Highly detectable (Average filled value ≥ 80 %) Low sex or age differences (Fold change < 50 % with P > 0.05) Low inter-individual variation (Average relative standard division ≤ 0.5) B Plasma Serum Highly detectable (236) Highly detectable (225) 124 124 Low inter-individual variation (169) Low gender and age differences (218) Low inter-individual variation (173) Low gender and age differences (221) Supplemental figure 2. Proposal for biomarker candidates with suitable background characteristics. A. Our strategy to select biomarker candidates with suitable background characteristics. B. Venn diagram represents the number of metabolites fulfilled each criteria and all criteria.


