Download
1 / 16
160 likes | 303 Views
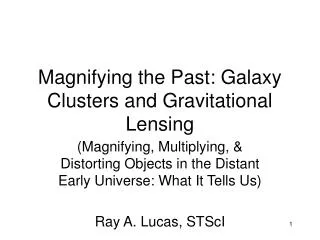
A galaxy at redshift 10?. Brigitta Eder Vera Könyves Juan Carlos Muñoz Mateos Magdalena Poli ń ska Tutor: Mischa Schirmer. ESO, Garching 08 September 2006. Plan. Overview. Presenting the data. Data reduction. Results. Magdalena Poli ń ska. Overview.

E N D
A galaxy at redshift 10? Brigitta Eder Vera Könyves Juan Carlos Muñoz Mateos Magdalena Polińska Tutor: Mischa Schirmer ESO, Garching 08 September 2006
Plan Overview Presenting the data Datareduction Results Magdalena Polińska
Overview The imaging of the lensing cluster A1835 was obtained at ESO/VLT with the NIR imaging spectrograph ISAAC. Photometric data were complemented by deep VRI observations (CFHT) and R band (HST) images. Magdalena Polińska
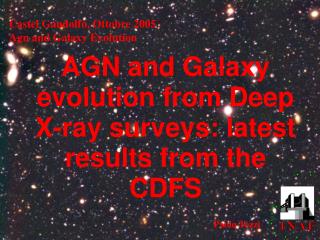
Overview Pelló et al., 2004: The core of the lensing cluster A1835 with the position of the slit used during spectroscopic survey. Magdalena Polińska
Overview Gemini H-Band Imaging of the Field of a z = 10 Candidate Bremer M.N. et al. 2004, ApJ Reanalysis of the spectrum of the z = 10 galaxy Weatherley S.J. et al. 2004, A&A Deep Very Large Telescope V-Band Imaging of the Field of a z = 10 Candidate Galaxy: Below the Lyman Limit? Lehnert M.D. et al. 2005, ApJ Optical and Infrared Nondetection of the z = 10 Galaxy behind Abell 1835 Smith G.P. et al. 2006, ApJ Magdalena Polińska
Presenting the data Instruments: ISAAC – Infrared Spectrometer and Array Camera FOV 2.5 x 2.5 arcmin, 0.148 ”/pixel Z (1.06m), J (1.25m), H (1.65m), K (2.2m) FORS1 – Focal Reducer/low dispersion Spectrograph 1 FOV 6.8 x 6.8 arcmin, 0.20 ”/pixel V (554nm) Brigitta Eder
Presenting the data ESO Science Archive about 800 files retrieved: 600 object exposures, 200 flat fields & biases IR data - Preparation for the reduction sorting out object data taken at different dates retrieving of flats obtained over the same period reducing them separately Brigitta Eder
Reduction software Brigitta Eder
Data reduction 3. Object mask 1. Raw scientific frame 2. Flatfielded frame 5. Sky model subtracted 6. Collapse correction 4. Sky model Juan Carlos Muñoz Mateos
Data reduction 7. Weight map 8. Astrometry Objects are detected in each image and matched with the USNO – B1 astrometric catalog. Finer alignment and resampling is performed by measuring the residual shifts between the objects in each frame. 9. Final sky subtraction 10. Coadding 11. Final image Juan Carlos Muñoz Mateos
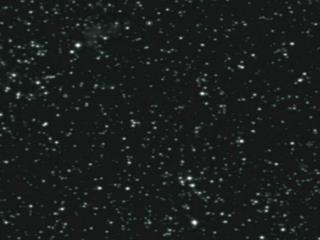
Data reduction ... and ended up with this. We began with this ... Juan Carlos Muñoz Mateos
Z J H K ZJHK Results Pelló et al., 2004: Our reduced data: Vera Könyves
Results Pelló et al., 2004 The z = 10 galaxy was not detected! Vera Könyves
Results of the “extra” work We ran SExtractor in order to determine the limiting magnitudes DETECT_MINAREA 4 DETECT_THRESHOLD 1 DEBLEND_MINCONT 0.000005 Galaxy number counts Limiting magnitudes for the 5 bands: V: 28.3 mag Z: 25.8 mag J: 26.8 mag H: 26.7 mag K: 25.5 mag Vera Könyves
Results of the “extra” work Search for drop-outs in different filters by blinking Vera Könyves
Results of the “extra” work VJH color image ZJH color image Vera Könyves