Electrocardiography
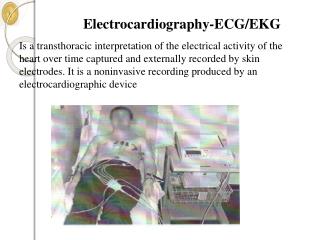
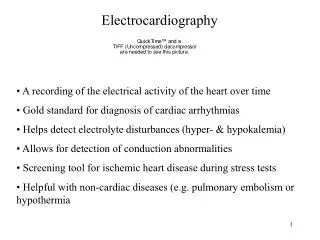
Electrocardiography. A recording of the electrical activity of the heart over time Gold standard for diagnosis of cardiac arrhythmias Helps detect electrolyte disturbances (hyper- & hypokalemia) Allows for detection of conduction abnormalities

Electrocardiography
E N D
Presentation Transcript
Electrocardiography • A recording of the electrical activity of the heart over time • Gold standard for diagnosis of cardiac arrhythmias • Helps detect electrolyte disturbances (hyper- & hypokalemia) • Allows for detection of conduction abnormalities • Screening tool for ischemic heart disease during stress tests • Helpful with non-cardiac diseases (e.g. pulmonary embolism or hypothermia
Electrocardiogram (ECG/EKG) • Is a recording of electrical activity of heart conducted thru ions in body to surface Fig 13.22a 13-60
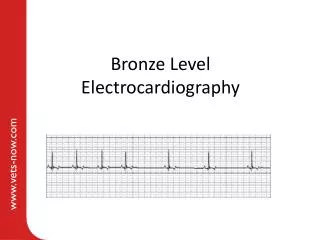
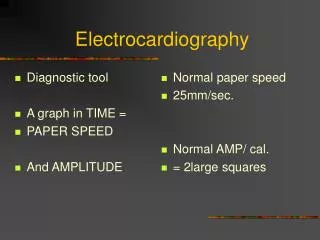
ECG Graph Paper • Runs at a paper speed of 25 mm/sec • Each small block of ECG paper is 1 mm2 • At a paper speed of 25 mm/s, one small block equals 0.04 s • Five small blocks make up 1 large block which translates into 0.20 s (200 msec) • Hence, there are 5 large blocks per second • Voltage: 1 mm = 0.1 mV between each individual block vertically
Normal conduction pathway: SA node -> atrial muscle -> AV node -> bundle of His -> Left and Right Bundle Branches -> Ventricular muscle
Recording of the ECG: • Leads used: • Limb leads are I, II, II. So called because at one time subjects had to literally place arms and legs in buckets of salt water. • Each of the leads are bipolar; i.e., it requires two sensors on the skin to make a lead. • If one connects a line between two sensors, one has a vector. • There will be a positive end at one electrode and negative at the other. • The positioning for leads I, II, and III were first given by Einthoven. Form the basis of Einthoven’s triangle.
Types of ECG Recordings • Bipolar leads record voltage between electrodes placed on wrists & legs (right leg is ground) • Lead I records between right arm & left arm • Lead II: right arm & left leg • Lead III: left arm & left leg Fig 13.23 13-61
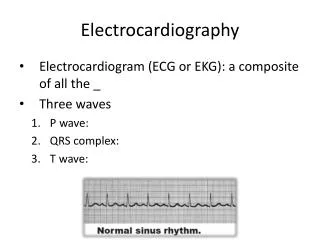
ECG • 3 distinct waves are produced during cardiac cycle • P wave caused by atrial depolarization • QRS complex caused by ventricular depolarization • T wave results from ventricular repolarization Fig 13.24 13-63
Elements of the ECG: • P wave: Depolarization of both atria; • Relationship between P and QRS helps distinguish various cardiac arrhythmias • Shape and duration of P may indicate atrial enlargement • PR interval: from onset of P wave to onset of QRS • Normal duration = 0.12-2.0 sec (120-200 ms) (3-4 horizontal boxes) • Represents atria to ventricular conduction time (through His bundle) • Prolonged PR interval may indicate a 1st degree heart block • QRS complex: Ventricular depolarization • Larger than P wave because of greater muscle mass of ventricles • Normal duration = 0.08-0.12 seconds • Its duration, amplitude, and morphology are useful in diagnosing cardiac arrhythmias, ventricular hypertrophy, MI, electrolyte derangement, etc. • Q wave greater than 1/3 the height of the R wave, greater than 0.04 sec are abnormal and may represent MI
ST segment: • Connects the QRS complex and T wave • Duration of 0.08-0.12 sec (80-120 msec • T wave: • Represents repolarization or recovery of ventricles • Interval from beginning of QRS to apex of T is referred to as the absolute refractory period • QT Interval • Measured from beginning of QRS to the end of the T wave • Normal QT is usually about 0.40 sec • QT interval varies based on heart rate
Elements of the ECG: • P wave • Depolarization of both atria; • Relationship between P and QRS helps distinguish various cardiac arrhythmias • Shape and duration of P may indicate atrial enlargement
QRS complex: • Represents ventricular depolarization • Larger than P wave because of greater muscle mass of ventricles • Normal duration = 0.08-0.12 seconds • Its duration, amplitude, and morphology are useful in diagnosing cardiac arrhythmias, ventricular hypertrophy, MI, electrolyte derangement, etc. • Q wave greater than 1/3 the height of the R wave, greater than 0.04 sec are abnormal and may represent MI
PR interval: • From onset of P wave to onset of QRS • Normal duration = 0.12-2.0 sec (120-200 ms) (3-4 horizontal boxes) • Represents atria to ventricular conduction time (through His bundle) • Prolonged PR interval may indicate a 1st degree heart block
T wave: • Represents repolarization or recovery of ventricles • Interval from beginning of QRS to apex of T is referred to as the absolute refractory period
ST segment: • Connects the QRS complex and T wave • Duration of 0.08-0.12 sec (80-120 msec • QT Interval • Measured from beginning of QRS to the end of the T wave • Normal QT is usually about 0.40 sec • QT interval varies based on heart rate
Ischemic Heart Disease • Is most commonly due to atherosclerosis in coronary arteries • Ischemia occurs when blood supply to tissue is deficient • Causes increased lactic acid from anaerobic metabolism • Often accompanied by angina pectoris (chest pain) Click here to play Myocardial Infarction RealMedia Movie 13-78
Ischemic Heart Disease • Detectable by changes in S-T segment of ECG • Myocardial infarction (MI) is a heart attack • Diagnosed by high levels of creatine phosphate (CPK) & lactate dehydrogenase (LDH) Fig 13.34 13-79
Arrhythmias Detected on ECG • Arrhythmias are abnormal heart rhythms • Heart rate <60/min is bradycardia; >100/min is tachycardia Fig 13.35 13-80
Arrhythmias Detected on ECG continued • In flutter contraction rates can be 200-300/min • In fibrillation contraction of myocardial cells is uncoordinated & pumping ineffective • Ventricular fibrillation is life-threatening • Electrical defibrillation resynchronizes heart by depolarizing all cells at same time Fig 13.35 13-81
Arrhythmias Detected on ECG continued • AV node block occur when node is damaged • First–degree AV node block is when conduction through AV node > 0.2 sec • Causes long P-R interval • Second-degree AV node block is when only 1 out of 2-4 atrial APs can pass to ventricles • Causes P waves with no QRS • In third-degree or complete AV node block no atrial activity passes to ventricles • Ventricles driven slowly by bundle of His or Purkinjes 13-82
Arrhythmias Detected on ECG continued • AV node block occurs when node is damaged • First–degree AV node block is when conduction thru AV node > 0.2 sec • Causes long P-R interval Fig 13.36 13-83
Arrhythmias Detected on ECG continued • Second-degree AV node block is when only 1 out of 2-4 atrial APs can pass to ventricles • Causes P waves with no QRS Fig 13.36 13-84
Arrhythmias Detected on ECG continued • In third-degree or complete AV node block, no atrial activity passes to ventricles • Ventricles are driven slowly by bundle of His or Purkinjes Fig 13.36 13-85
Representation in culture • In TV medical dramas, an isoelectric ECG (no cardiac electrical activity, aka, flatline, is used as a symbol of death or extreme medical peril. • Technically, this is known as asystole, a form of cardiac arrest, with a partcularly bad prognosis. • Defibrillation, which can be used to correct arrythmias such as ventricular fibrillation and pulseless ventricular tachycardia, cannot correct asystole.