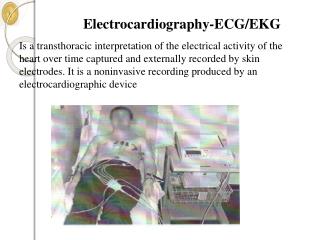
Electrocardiography
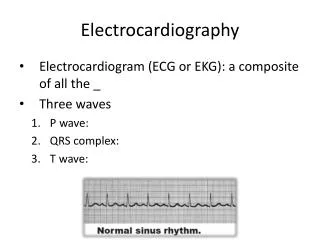
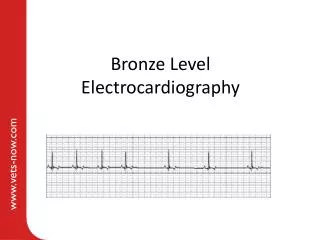
Diagnostic tool A graph in TIME = PAPER SPEED And AMPLITUDE. Normal paper speed 25mm/sec. Normal AMP/ cal. = 2large squares. Electrocardiography. P wave: atrial activity Q significant in MI R first upward deflection S downward stroke T repolarisation.

Electrocardiography
E N D
Presentation Transcript
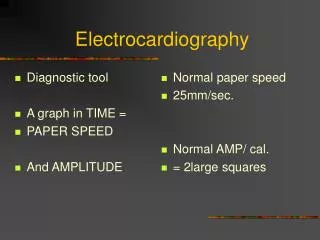
Diagnostic tool A graph in TIME = PAPER SPEED And AMPLITUDE Normal paper speed 25mm/sec. Normal AMP/ cal. = 2large squares Electrocardiography
P wave: atrial activity Q significant in MI R first upward deflection S downward stroke T repolarisation Each component has a normal speed. Ie width Also has a normal AMP /height. These normal values are static. Components of the ECG
Each of the twelve leads views and records activity in a different areas of the hearts surface. AVR. ATRIA L1. LATERAL(high) L2 LATERAL L3 INFERIOR LAVL. LATERAL LAVF.INFERIOR The Leads
The chest leads . View the anterior surface of the heart. Which anatomically Is made up of the ventricles. V1 / V2. RT VENT V3 / V4 SEPTUM V5 / V6 LFT VENTRICLE The Leads
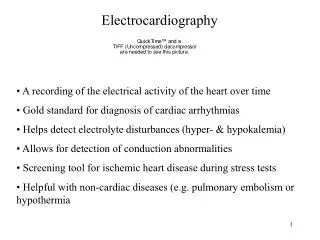
Information recorder by an ecg • Hearts rate of contraction. • Heart rythem. • Endo and Myocardial damage • Hypertension • Left Ventricular Failure. • Ethinicity • PE. • Conduction defect.
Interpretation • Correct calibration. • I calculate the rate. • Identify the rythem • Recognise the axis. • Look for acute changes.
Rythems • RATE = 60 – 100 bpm • Rythem. A.P wave before each QRST • A positive lead 11 and a negative V! • This is sinus rythem
Sinus bradycardia • Rate below 60.bpm • A p wave before each QRST. • Pos. L2 and NEG V1 • Tx. Nothing unless ?????
Sinus Tachycardia • Rate 100 – 150. • P wave before each QRST • Pos.L2 neg V1. • No tx unless???? Causes ?????
SVT • Rate above 150. • Regular. • P waves present. • Tx.??????
ATRIAL FIB. • RATE.. Variable • Rythem irregularly/irregular • No obvious p wave. Multiples of waves • Tx.?????
Cardiac Axis. Directional flow of an impulse 11. To 5 oclock configuration. Think of the conduction system SA.node. AV.node.Bundle of Hiss. And Branches. Purkinjee fibres.
Axis • When an impulse is traveling towards and electrode it will be positive. • When travelling away it will be negative. • Normal ecg. Lead 2 is the most positive and V1 the most neg.