Download
1 / 57
570 likes | 674 Views
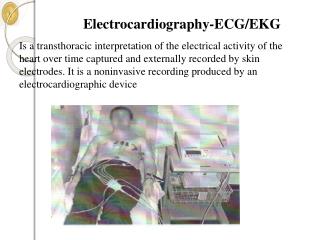
Learn to interpret ECG tracings, calculate heart rate, identify rhythms, and understand vectorial analysis. Master the principles of the mean electrical axis & Einthoven's triangle for comprehensive ECG analysis.

E N D
Electrocardiography – Normal6 Faisal I. Mohammed, MD, PhD
Objectives • Recognize the normal ECG tracing • Calculate the heart rate • Determine the rhythm • Calculate the length of intervals and determine the segments deflections • Draw the Hexagonal axis of the ECG • Find the mean electrical axis of QRS (Ventricular depolarization)
Principles of Vectorial Analysis of EKG’s • The current in the heart flows from the area of depolarization to the polarized areas, and the electrical potential generated can be represented by a vector, with the arrowhead pointing in the positive direction. • The length of the vector is proportional to the voltage of the potential. • The generated potential at any instance can be represented by an instantaneous mean vector. • The normal mean QRS vector is 60o (-30◦ - 110◦)
+ + + + + + + + + + + + + + + + + + + + + + + + + + + + + + + + + + + + + + + + + + + + + + + + + + + + Mean Vector Through the Partially Depolarized Heart _ _ _ _ + + _ _ + _ _ + _ _ _ + _ _ _ + _ _ _ _ _ + + _ _ _ + _ _ _ _ _ + _ _ _ _ _ _ _ _ _ _ _ _ _ _ _ +
Einthoven’s triangle and law + + +
Axes of the Three Bipolar and Augmented Leads aVF _ _ _ II III aVL aVR + 210o -30o + I I 0o _ + _ 60o aVR aVL _ 120o 90o II + III + aVF + Principles of Vectorial Analysis of EKG’s (cont’d)
Axes of the Unipolar Limb Leads I + + aVL aVR - aVF +
Principles of Vectorial Analysis of EKG’s (cont’d) • The axis of lead I is zero degrees because the electrodes lie in the horizontal direction on each of the arms. • The axis of lead II is +60 degrees because the right arm connects to the torso in the top right corner, and left leg connects to the torso in the bottom left corner. • The axis of lead III is 120 degrees.
Principles of Vectorial Analysis of EKG’s (cont’d) • In figure B, the depolarization vector is large because half of the ventricle is depolarized. • Lead II should be largest voltage when compared to I and III when the mean vector is 60o. • In figure C, left side is slower to depolarize. • In figure D, the last part to depolarize is near the left base of the heart which gives a negative vector (S wave). • Q wave is present if the left side of the septum depolarizes first.
The T Wave (Ventricular Repolarization) • First area to repolarize is near the apex of the heart. • Last areas, in general, to depolarize are the first to repolarize. • Repolarized areas will have a + charge first; therefore, a + net vector occurs and a positive T wave
Atrial Depolarization (P-Wave) and Atrial Repolarization (Atrial T Wave) • Atrial depolarization begins at sinus node and spreads toward A-V node. • This should give a + vector in leads I, II, and III. • Atrial repolarization can’t be seen because it is masked by QRS complex. • Atrial depolarization is slower than in ventricles, so first area to depolarize is also the first to repolarize. This gives a negative atrial repolarization wave in leads I, II, and III
Vectorcardiogram • This traces vectors throughout cardiac cycle. • When half of the ventricle is depolarized, vector is largest. • Note zero reference point, number 5, is point of full depolarization.
Determining Mean Electrical Axis • Use 2 different leads • Measure the sum of the height and the negative depth of the QRS complex • Measure that vaule in mm onto the axis of the lead and draw perpendicular lines • The intersection is at the angle of the mean axis.
Plot of the Mean Electrical Axis of the Heart from Two Electrocardiographic Leads III _ -60o I _ + I I II 180o 0o III 60o + 120o III
aVF SEVERE RIGHT OR LEFT AXIS DEVIATION OF QRS From 180 to 360 (-90) 90◦ LEFT AXIS DEVIATION OF QRS Lead I Lead I + 180◦ 0◦ NORMAL MEAN ELECTRICAL AXIS OF QRS From 0 to +90 RIGHT AXIS DEVIATION OF QRS From +90 to + 180 +90◦ aVF +
Heart Rate Calculation • R-R interval = 0.83 sec • Heart rate = (60 sec)/(0.83 sec) = 72 beats/min min beat
Determine regularity • Look at the R-R distances (using a caliper or markings on a pen or paper). • Regular (are they equidistant apart)? Occasionally irregular? Regularly irregular? Irregularly irregular? Interpretation? R R Regular
Electrocardiography – Abnormalities (Arrhythmias) 7 Faisal I. Mohammed, MD, PhD
Causes of Cardiac Arrythmias • Abnormal rhythmicity of the pacemaker • Shift of pacemaker from sinus node • Blocks at different points in the transmission of the cardiac impulse • Abnormal pathways of transmission in the heart • Spontaneous generation of abnormal impulses from any part of the heart
Abnormal Sinus Rhythms • Tachycardia means a fast heart rate usually greater than 100 beats /min. • Caused by (1) increased body temperature, (2) sympathetic stimulation (such as from loss of blood and the reflex stimulation of the heart), and (3) toxic conditions of the heart
Sinus Tachycardia • Etiology: SA node is depolarizing faster than normal, impulse is conducted normally. • Remember: sinus tachycardia is a response to physical or psychological stress, not a primary arrhythmia.
Abnormal Sinus Rhythms (cont’d) • Bradycardiameans a slow heart rate usually less than 60 beats /min • Present in athletes who have a large stroke volume • Can be caused by vagal stimulation, one example of which is the carotid sinus syndrome Heart Rate?
Sinus Bradycardia • Etiology: SA node is depolarizing slower than normal, impulse is conducted normally (i.e. normal PR and QRS interval) rate is slower than 60/beats per minute
Sinoatrial Block • In rare instances impulses from S-A node are blocked. • This causes cessation of P waves. • New pacemaker is region of heart with the fastest discharge rate, usually the A-V node. Note: no P waves and slow rate
ECGs, Abnormal Arrhythmia: conduction failure at AV node No pumping action occurs
Atrioventricular Block • Impulses through A-V node and A-V bundle (bundle of His) are slowed down or blocked due to : • (1) Ischemia of A-V nodal or A-V bundle fibers (can be caused by coronary ischemia) • (2) Compression of A-V bundle (by scar tissue or calcified tissue) • (3) A-V nodal or A-V bundle inflammation • (4) Excessive vagal stimulation
Incomplete Heart Block: First Degree Block • Normal P-R interval is 0.16 sec • If P-R interval is > 0.20 sec, first degree block is present (but P-R interval seldom increases above 0.35 to 0.45 sec)
Prolonged P-R Interval Prolonged P-R Interval First Degree Heart Block AV Node SA Node H T Delay
1st Degree AV Block • Etiology: Prolonged conduction delay in the AV node or Bundle of His.
Second Degree Incomplete Block • P-R interval increases to 0.25 - 0.45 sec • Some impulses pass through the A-V node and some do not thus causing “dropped beats”. • Atria beat faster than ventricles.
Blocked Conducted Conducted Blocked Second Degree Heart Block AV Node SA Node H T Intermittent Block
2nd Degree AV Block, • Etiology: Each successive atrial impulse encounters a longer and longer delay in the AV node until one impulse (usually the 3rd or 4th) fails to make it through the AV node.
Third Degree Complete Block • Total block through the A-V node or A-V bundle • P waves are completely dissociated from QRST complexes • Ventricles escape and A-V nodal rhythm ensues HR = 37
3rd Degree AV Block • Etiology: There is complete block of conduction in the AV junction, so the atria and ventricles form impulses independently of each other. Without impulses from the atria, the ventricles own intrinsic pacemaker beats at around 15 - 40 beats/minute.
Stokes-Adams Syndrome • Complete A-V block comes and goes. • Ventricles stop contracting for 5-30 sec because of overdrive suppression meaning they are used to atrial drive. • Patient faints because of poor cerebral blood flow • Then, ventricular escape occurs with A-V nodal or A-V bundle rhythm (15-40 beats /min). • Artificial pacemakers connected to right ventricle are provided for these patients.
Factors Causing Electrical Axis deviation • Changes in heart position: left shift caused by expiration, lying down and excess abdominal fat, short and obese. • Right shift caused by thin and tall person
Factors Causing Electrical Axis Deviation …cont’d • Hypertrophy of left ventricle (left axis shift) caused by hypertension, aortic stenosis or aortic regurgitation causes slightly prolonged QRS and high voltage.
Factors Causing Electrical Axis Deviation (cont’d) • Hypertrophy of right ventricle (right axis shift) caused by pulmonary hypertension, pulmonary valve stenosis, interventricular septal defect. All cause slightly prolonged QRS and high voltage.
Factors Causing Electrical Axis Deviation …cont’d • Bundle branch block-Left bundle branch block causes left axis shift because right ventricle depolarizes much faster than leftventricle. QRS complex is prolonged. By the same token Right bundle branch block causes right axis deviation.
ECG Deflection Waves Atrial repolarization (Pacemaker) 48
ECG Deflection Waves 60 seconds ÷ 0.8 seconds = resting heart rate of 75 beats/minute 1st Degree Heart Block = P-Q interval longer than 0.2 seconds. 49
ECG Deflection Wave irregularities Enlarged QRS = Hypertrophy of ventricles 50