Download
1 / 62
620 likes | 655 Views
Practical Electrocardiography - Introduction -. Scott E. Ewing DO Interventional Cardiology Fellow Lecture #1. Introduction. Electrophysiology Depolarization Anatomy EKG Paper Lead Placement Normal EKG Waves / Intervals / Segments. Cardiac Action Potential.

E N D
Practical Electrocardiography- Introduction - Scott E. Ewing DO Interventional Cardiology Fellow Lecture #1
Introduction • Electrophysiology • Depolarization • Anatomy • EKG Paper • Lead Placement • Normal EKG • Waves / Intervals / Segments
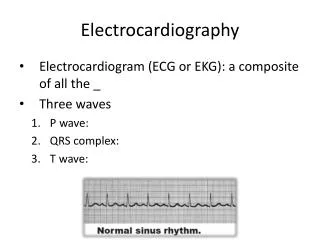
Cardiac Action Potential • SA node, AV, Purkinje cells display pacemaker activity (phase 4 depolarization) • Body surface manifestation of the depolarization and repolarization waves • P wave is generated by atrial depolarization • QRS by ventricular muscle depolarization • T wave by ventricular repolarization • PR interval is a measure of conduction time from atrium to ventricle • QRS duration indicates the time required for all of the ventricular cells to be activated (i.e., the intraventricular conduction time) • QT interval reflects the duration of the ventricular action potential
Cardiac Action Potential • Phase 0: Rapid depolarization • Sodium moves rapidly into the cell • Calcium moves slowly into the cell • Phase 1: Early repolarization • Sodium channels close • Phase 2: Plateau • Calcium continues to flow in • Potassium continues to flow out • Phase 3: Rapid repolarization • Calcium channels close • Potassium flows out rapidly • Active transport Na+ / K+ pump • Phase 4: Resting • Cell membrane is impermeable to sodium • Potassium moves out
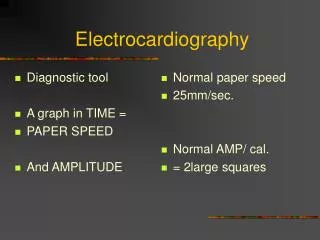
EKG Paper • Time intervals indicated for the thick and thin vertical grid lines • Amplitudes indicated for the thick and thin horizontal grid lines • Each small square 0.04 s × 0.1 mV and each large square 0.20 s × 0.5 mV
Willem Einthoven (1860 – 1927) • Dutch doctor and physiologist • Invented the first practical electrocardiogram in 1903 • Nobel Prize Medicine in 1924 • Died in Leiden in the Netherlands and is buried in the graveyard of the Reformed Church at 6 Haarlemmerstraatweg in Oegstgeest
Normal Findings • Tall R waves • Prominent U waves • ST segment elevation (hightake off, benign early repolarization) • Exaggerated sinus arrhythmia • Sinus bradycardia • Wandering atrial pacemaker • Wenckebach phenomenon • Junctional rhythm • 1st degree heart block
P Wave • Atrial activation begins in the SA node • Spreads in radial fashion to depolarize the right atrium, interatrial septum, then the left atrium • Last area of the left atrium to be activated is the tip of the left atrial appendage • Normal amplitude • Seldom exceeds 0.25 mV (2.5 small squares) normally in limb leads • In precordial leads, positive component is normally less than 0.15 mV
P Wave Characteristics • Positive in leads I and II • Best seen in leads II and V1 • Commonly biphasic in lead V1 • < 120 ms (3 small squares) in duration • < 100 ms (2.5 small squares) in amplitude
PR Interval • Beginning P wave to beginning QRS complex • Interval between onset atrial depolarization and onset ventricular depolarization • Time required for the activation impulse to advance from atria through the AV node, bundle of His, bundle branches, Purkinje fibers until ventricular myocardium begins to depolarize • Normal PR Interval • 120 – 200 ms (adults) • Should be taken from lead with the largest and widest P wave and longest QRS duration
PR Segment • Horizontal line between the end of the P wave and the beginning of the QRS complex • Duration depends on the duration of the P wave as well as the impulse conduction through the AV junction • Usually isoelectric, however it is often displaced in a direction opposite to the polarity of the P wave • Depressed in most of the conventional leads except aVR • Displacement is mainly due to atrial repolarization
QRS Complex • Q wave – Any initial negative deflection • R wave – Any positive deflection • S wave – Any negative deflection after an R wave
QRS Complex • Resultant electrical forces generated from ventricular depolarization • Begins at middle third of left interventricular septal surface • Spreads in a rightward direction • RV begins to depolarize shortly after initiation of LV activation • Basal portion of septum and posterobasal portion of LV free wall are last areas of depolarization • LV contributes most of the QRS forces due to larger muscle mass
QRS Complex • QRS duration represents duration of ventricular activation • Should be measured from lead with widest QRS complex • Traditionally measured from the limb leads, but V1 or V2 may have the widest complex • Normal QRS varies between 60 – 110 ms
QRS Complex • Lead I: usually records a dominant R wave • Lead II: invariably has prominent R wave since mean vector is always toward II if QRS axis is normal • Lead aVR: always records negative deflection • Lead III: variable
ST Segment • Segment between end of QRS complex (J point) and beginning of T wave • Represents state of unchanged polarization between end of depolarization and beginning of repolarization • Stage when terminal depolarization and starting repolarization are superimposed and cancel each other
ST Segment • Most important information regarding ST segment is presence or absence and degree of displacement from isoelectric line • TP segment is used as reference baseline • Limb leads – elevation or depression < 1mm • Precordial leads- elevation sometimes seen and normal in V2-V3 (< 2mm), rarely > 1mm in V5-V6 • Any ST depression in precordial leads is abnormal (normal vector in horizontal plane is anterior and leftward)
T Wave • Represents potential for ventricular repolarization • Proceeds in general direction of ventricular excitation • Polarity of resultant T wave is similar to that of the QRS vector • Upright in I, II, V5-V6 • Inverted in aVR • When inverted in 2 or more of right precordial leads, referred to as persistent juvenile pattern
T Wave • Limb leads • Tallest in lead II • Normally < 6mm in all limb leads • Should never be < 0.5mm • Precordial leads: • Tallest in V2-V3 (average 6mm) • Smaller in left precordial leads