Screen and Bypass Design
Screen and Bypass Design. Bryan Nordlund, P.E. National Marine Fisheries Service Lacey, Washington Note: this presentation represents the views of the presenter, and in most cases, is based on fishway design experience in working for NMFS.


Screen and Bypass Design
E N D
Presentation Transcript
Screen and Bypass Design Bryan Nordlund, P.E. National Marine Fisheries Service Lacey, Washington Note: this presentation represents the views of the presenter, and in most cases, is based on fishway design experience in working for NMFS. Special thanks to Larry Swenson for the assistance with slide content.
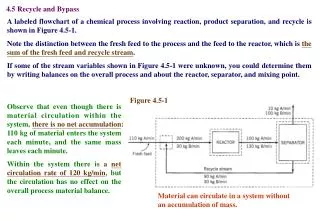
Hydrology and Hydraulics Hydrology relates to the science dealing with the occurrence, circulation and distribution of water on the earth's lands and in the atmosphere. Hydraulics refers to fluids in motion. Hydrology doesn't make fish barriers (unless streamflow gets too low or too high), but hydraulics can create a barrier.
Example: Using 5% and 95% exceedence flow range in fish passage design • Suppose assessment using previously demonstrated method yields: Q5 = 11,250 cfs and Q95 = 210 cfs. • Using a tailwater rating curve, the water surface elevations for an bypass outfall location can be determined.
Some Dam Tailwater Rating Curve Q5 = 11,250 cfs WSE = 628.8 ft Tailwater Water Surface Elevation, in Feet Q95 = 210 cfs WSE = 624.4 ft River Flow, in CFS
More About Design Flow guidelines • Fishway design flow should consider specific migration timing information for all species and life stages intended to pass. • This will contract, expand or shift the design flow range. • Providing optimal passage for 90% of the passage season does not mean that 10% of the run is not passed.
In some rivers, passage may be impaired by extreme flow events. Note: Flow in lower ladder is flowing UP the ladder Bonneville Dam – May31, 1948 985,000 CFS
More About Design Flow guidelines (continued) • Passage of the entire run is expected to occur as streamflow conditions improve. • Passage facilities can provide passage beyond the design flow range even if the facility is not within design criteria.
Data needs for determining screen and bypass flows • Rating curves (flow vs.water surface elevation) and flow records for point of diversion, canal (if applicable), and bypass outfall. The greater the data range - the better, but often you will need to work with what you have. • Maximum and minimum diverted flow. • Canal cross sections, at least at the proposed screen site.
Hydraulics - Objective: • Given:hydrology, biological criteria, and the design criteria -- • Determine:size and hydraulic capacity of key fishway components • Calculate:Flow rates for • Weirs • Orifices • Open Channels
Calculating Discharge (Q) LJ S NOAA Fisheries 4-28-03
Velocity Head • When water moves from point A to point B, velocity head, is calculated by : • (equation 1) hv = V2 / 2g , where • hv is velocity head differential from A and B • V is water velocity between A and B • g is the gravitational constant 32.2 feet per second squared.
Velocity Head • Why does Velocity Head matter? • Because if velocity is fast enough, the water surface will decrease downstream.
Example: velocity head as flow approaches a weir If water velocity at point B is 4 fps, and at point A is nearly zero, then velocity head at point B is calculated as: hv = V2 / 2g (equation 1) = (4 fps)2 /(2 x 32.2 ft/s2 ) = 16/64.4 (do units check?) = 0.25 feet A velocity head of 0.25 feet means that the water surface will drop 0.25 feet from A to B, assuming that velocity at A is nearly zero.
Weir Flow – Free Discharge Equation 2: Q=CwL(H + 2 )3/2 Vo 2g Where: Cw = Weir Coefficient (handbook) L = Weir Length H= Head across weir Vo2/2g = Velocity Head Sharp crested weir
Weir Flow – Submerged Discharge Qsubmerged = Q/Q1 x Qunsubmerged
Example: Submerged Weir If H1=1 ft and H2 = .33 ft, then H2/H1=.33 If H2/H1=.33, then Q/Q1= 0.85 (chart) Then Qsubmerged = 0.85 x Qunsubmerged, with Qunsubmerged from equation 2
Orifice Flow – Contraction (Cc), Velocity (Cv) and Discharge (Cd) Coefficients Thin Wall Orifices Short Tube Bell Mouth
(Circular) Orifice Flow – Free Discharge Q = AV = CdAo(2gDH)0.5 Where : Cd is orifice discharge coefficient Ao is the area of the orifice ΔH is the water surface drop through the orifice to impact point
(Circular) Orifice Flow – Submerged Discharge Cd = CcCv Q = AV = CdAo(2gDH)0.5
The entire fishway flow passes through two 18” x 24” orifices with a 0.75 foot difference in water surface elevation. The forebay velocity is 0.1 ft/s. Calculate the orifice flow rate.
Example: calculation of orifice flow • First, calculate the velocity head (equation 2): • hv = 0.12 / (2 x 32.2) = .00016 ft • Using equation 4: Q = 0.61 x A x [2g(H+ hv)] ½ • Q = 0.61 x 18/12 ft x 24/12 ft x [2 x 32.2 x (9/12 + 0.00016) ft] ½ • = 0.61 x 1.5 x 2 x 6.95 = 12.7 cfs, • Or, Q = 25.4 cfs for both orifices • Note that the calculated velocity head is negligible (slow forebay velocity) • Note that the coefficient of 0.61 is onlyfor a rectangular orifice. • For further guidance on various orifice coefficients for a variety of shapes, see “Water Measurement Manual”, U.S. Bureau of Reclamation, Denver, Colorado, 1981.
Open Channel Flow – Manning’s Equation n = Manning’s Roughness Coefficient (find using Google) Rh = Hydraulic radius in feet = flow area (A) ÷ flow perimeter (p) So = Slope of channel in feet/feet Note: Flow perimeter is where flow contacts the channel sides (not the water surface)
Elev. 1.0’ Elev.0.0’ 250 feet Elevation View - Concrete channel So = (1.0 – 0.0)/250 = 0.004 ft/ft Ao = 3 x 1 = 3 square feet Rh = 1 +1 +3 = 5 feet 1 foot N = 0.015 (smooth concrete) V= 1.49 0.015 2/3 1/2 3 feet x 5 x 0.004 = 18.4 feet per second Cross section Flow (Q) = V x A = 18.4 x 3 = 55 cubic feet per second Flow --->
Modeling Tools Computational Fluid Dynamics (CFD) Models Scaled Physical Models
Handy Conversions 1 cubic feet per second = 448.8 gallons per minute 1 gallon per minute = 1440 gallons per day 1 cubic meter per second = 35.31 cubic feet per second 1 cubic foot per second = 2 acre-feet per day 1 acre-foot per day = 0.504 cubic feet per second 1 cubic feet = 7.48 gallons 1 cubic foot of water = 62.4 pounds 1 gallon of water = 8.34 pounds 1 foot per second = 0.3048 meters per second (degrees F – 32) x 5/9 = degrees Celsius 1 kilogram = 2.2 pounds 1 foot per second = 1.097 kilometers per hour = 0.682 miles per hour = 16.4 miles per day Or e-mail me at Bryan.Nordlund@noaa.gov for a handy conversions freeware