Download
1 / 24
390 likes | 1.09k Views
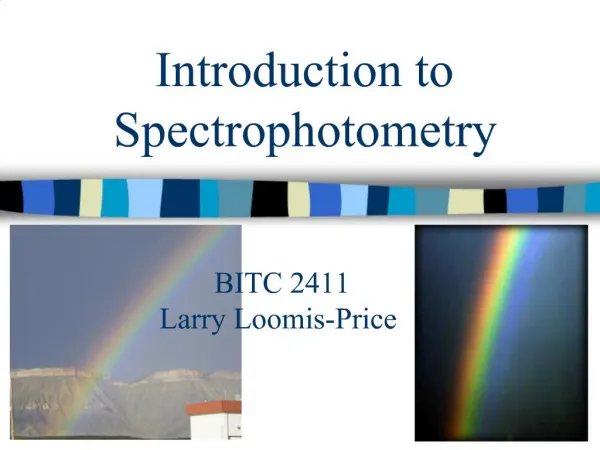
Introduction to Spectrophotometry. Why Spectrophotometry?. Imagine you are to make a 1 μ M solution of a specific protein that you believe could have anti-carcinogenic properties. Unfortunately if the protein is 100X more concentrated it has serious side effects.

E N D
Why Spectrophotometry? • Imagine you are to make a 1μM solution of a specific protein that you believe could have anti-carcinogenic properties. • Unfortunately if the protein is 100X more concentrated it has serious side effects. • How could you be sure of the concentration?
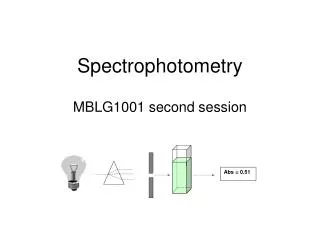
Why Spectrophotometry? • A spectrophotometer or “spec” could be used to quantify the concentration of a solution. • A spec shines a beam a light on a sample. • The molecules in the sample either absorb light energy, reflect the light or the light transmits between the atoms and molecules of the sample.
Spectrophotometry Overview • The spec measures the amount of light transmitted through the sample or transmittance. • Although the spec measures the percent of light transmitted (%T), by using an equation it can convert the transmittance data to absorbance. • Absorbance or transmittance data can then be compared to known standard curves to quantify a sample.
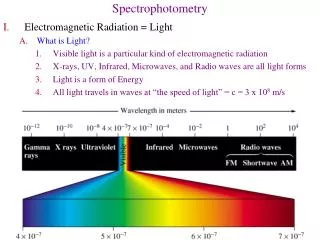
Spectrophotometry Overview • Spectrophotometers shine either UV light, visible light or both on a sample. • Depending on the sample, different parts of the EM spectrum are used.
Physics Review • Why do blue objects look blue? • The object absorbs all other wavelengths of visible light except blue which is reflected. • Visible, or white, light ranges from blues at 350 nm to red at 700 nm • The different wavelengths of light also contain different amounts of energy. • The spec detects the differences in energy
How a Spec Works Features • UV/VIS Specs contain two lamps • Tungsten lamp – 350-700 nm • Deuterium lamp – 200-350 nm • Wide variety of other options • Scanning • Time or wavelength • Digital / graphic output • One dial
How a Spec Works Features • Common features (Spec 20) • Lamp, prism or grating, sample holder, display, detector, and knob • Our spec (Spec 20) • Knob rotates a prism which directs a different color through the sample • Fancy specs have an automatic feature that scans for the maximum absorbance which then indicates the ideal wavelength for that sample
How a Spec Works • The wavelengths of light from tungsten lamp shine on a sample. • The molecules in the sample either absorb or transmit the light energy of one wavelength or another. • The detector measures the amount of light being transmitted by the sample.
How a Spec Works • The spec reports the value directly as (% transmittance) or converts it to the amount of light absorb in absorbance units (au). • To convert between transmittance and au the spec uses an equation based on Beer’s Law. • A=2-log10(%T)
How a Spec Works • Beer's law: the absorbance is directly proportional to the concentration of a solution. • So, as absorbance of a sample increases, the transmittance decreases and vice versa. • If molecules are not absorbing all the energy from a light beam, then the remaining light penetrates (transmits) through the sample.
Beer’s Law Beer’s law is a relationship between the light absorbance of a substance and its concentration It is often written: A = a×b×c where: A = Absorbance of solution a = absorptivity, or how well the substance absorbs light b = path length, length of sample holder c = concentration of solution
Beer’s Law Often a and b will not change in an experiment, we can combine them into a new constant, k. Thus: A = kc. Note that this is the equation of a straight line y = mx + b where y = A, x= c, m = k and b = 0. (Remember that m is the slope of the line, and b is the y-intercept.) Beer’s law then states that a plot of absorbance vs. concentration will give a straight line passing through the origin. Such a graph is labeled a Beer s Law Plot . The slope of the line is characteristic of and depends upon the solution used.
How a Spec Works • To be detected by a visible light spec, molecules must be colored or have a colored indicator added. • starch & iodine • protein and biuret’s solution • Colorless molecules are not detected by a VIS spec since the do not absorb any wavelengths within the white light.
How a Spec Works: A blue example • Consider a blue solution • When the white light shines on a blue molecule, all wavelength are absorbed except blue. • The blue wavelengths are transmitted or reflected off the molecules. • Some of these blue wavelengths hit the detector and blue light has a certain amount of energy.
How a Spec Works: An example • If the color of the solution is unknown, then all of the wavelengths could be measured and graphed. • An absorbance spectrum is a graph that shows a samples at different wavelengths. • The peaks on the spectrum would indicate the wavelength at which a molecule absorbs the most light is called lambamax.
How a Spec Works: A “clear” example • Molecules such as proteins and nucleic acids, DNA & RNA, are often the most important in biotech labs. • When proteins and DNA are in solution they are “colorless” or do not absorb light in the visible light spectrum. • In order to assay, measure, these solutions either a UV light needs to be used or an indicator is added to the solution.
How a Spec Works: A “clear” example • Proteins can be made visible by adding Bradford reagent or Biuret reagent. • Diphenylamine (DPA) or ethidium bromide (EtBr) make nucleic acids visible. • DPA turns DNA blue and RNA green • EtBr interacts with DNA and UV light by glowing orange
How a Spec Works Identification • Certain molecules have known values for lambamax. • This can be used to identify unknowns in a solution. • Hemoglobin absorbs the most light at 395 nm, so any solution with a peak at 395 may indicate the possible presence of hemoglobin.
How a Spec Works Concentration • The concentration of a solution also affects the solution’s absorbance. • If there are more molecules in one solution then another, then there are more molecules to absorb light. • The amount of light that a sample absorbs indicates how many molecules (the concentration) are present.
How a Spec Works Concentration • If there are twice as many molecules in a solution, there would be twice as much absorbance. • Likewise, half as many molecules absorb half as much light. • On a plot of absorbance versus concentration, the resulting graph yields a straight line. The equation for the straight line (termed regression line) can be used to determine the concentration of an unknown solution once the %T has measured.
How a Spec Works Concentration • Some specs can monitor changes in samples over time. • Enzyme studies are conducted by monitoring the change in a colored product over time.
Review Questions • What is measured in a spectrophotometer? • What is the difference in a UV and VIS spec? • What happens to the absorbance of a sample as the concentration of a sample increases or decreases? • What color of light has a wavelength of 530 nm? • If a molecule absorbs light at 530 nm, what color would it be? • What color do we no it is not?