Download
1 / 29
290 likes | 397 Views
Explore the impact of air pollution on urban areas, effective strategies for emission reduction, local air quality management, and key considerations for improving urban air quality worldwide. Discover how urban hotspots, emissions, and traffic affect air quality and public health.

E N D
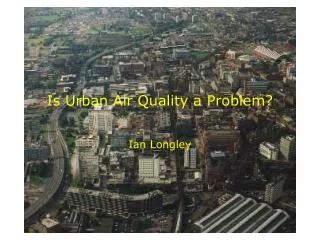
Is Urban Air Quality a Problem? Ian Longley
Health effects of NO2 & PM10 • Reduction of 1 mg/m3 in PM10 could lead to gain in life expectancy of 0.5 weeks at cost of £1bn+ (IGCB Report to DETR, 2001) . • Saving to NHS order or £1m p.a.
National Air Quality StrategyObjectives (UK) Exceedences allow for unfavourable meteorology
The current state of UK Air Quality Major determinant of air pollution concentrations is the wind
National / international emission abatement strategies: Engines
(Inter)national strategies: Petrol/Diesel • ULSP/ULSD (<50ppm) available from 2000, all fuel by 2005 • EU consulting on 10ppm S limit • Low Benzene Petrol (also ULSP) • City Diesel (7ppm S, 30% less PM, up to 88% for buses with particle trap)
(Inter)national strategies: Alternative Fuels: Chemical • LPG – 25000 on the road in UK (including hybrids), 80% less PM for buses • CNG – UK has 20 filling stations, 50-90% less PM • 140 CNG buses operating in France • Biodiesel • Best options for LDVs in next 10-20 years
(Inter)national strategies: Alternative Fuels - Others • Hybrid – petrol/electric: • Toyota Prius & Honda Insight • Electric – Peugeot 106, Bristol park & ride buses, Cambridge solar bus • Fuel cells (from 2010? London trial buses in 2003)
Local Air Quality Management • Environment Act 1995: Local Authority duty • Create Emission Inventories • Dispersion modelling to predict concentrations NOW and in 2005 • Identify areas where 2005 objectives will NOT be met.
Air Quality Management Areas, e.g. Greater Manchester • AQMA declared where 2005 objective for NO2 will NOT be met.
AQMAs • 3 million live within AQMAs, mostly in Greater London. • RESULT: most L.A.s report most Objectives WILL be met, EXCEPT NO2 and PM10 in urban areas and near major roads. • L.A.s must draw up Action Plans for AQMAs.
Action Plan options 1: restrictions • Low Emission Zone (e.g. central London predicted 16% reduction in NOx, 25% PM10 emissions), also Nottingham, Leicester, York, Bath • Council vehicle fleets • Congestion charging (London, Durham, Bristol, Edinburgh, Manchester) • Partial or total road closure • Bus/cycle/HGV/high-occupancy lanes • Parking controls/changes
Action Plan options 2 • Traffic calming • Traffic management (signalling, bollards) • Changing speed limits • Smooth driving styles • Rail and light-rail investment • Bus and park-and-ride investment • Public information and ‘encouragement’
Review & Assessment • Monitoring: modelling compared to measurements • Models consistently under-predict for NO2 and PM10 in urban areas, especially densely-built-up areas. • Models perform badly at predicting PM10.
The problem with PM10 • Fine mode (nm) mostly carbonaceous from exhausts. Main suspect in adverse health effects. • Coarse mode (mm) often crustal. Concentrations related to wind speed and direction. Much harder to control. • Mass measurements (PM10 ) dominated by coarse mode.
Urban hot-spots • Personal exposure study showed half of exposure of PM2.5 occurred over 15% of time, mostly when travelling (Rea et al, Jl. Air & Waste Manage. Assoc. vol.51, Sep 2001) • Epidemiological studies based on monitoring sites – R&A shows under-estimate exposure (Alm et al, Atmos. Env. Vol.35, 2001) • How far into surroundings does a hot-spot’s effects penetrate?
Street Canyon Aerosol Research - SCAR Particle concentrations and fluxes are dependent upon • Wind speed, • Wind direction and canyon assymetry, • Emission strength, • Surface heat emission, • Traffic-modified mean winds, • Traffic-induced turbulence (especially in low winds), • Particle size
Conclusions • Urban air quality improved in 1960s, but traffic growth compromised improvements. • Technological fixes to engines and fuels delivered big improvements and will do so for next 10 – 20 years, but diminishing returns. • Suburban and urban background air pollution is marginal – susceptible populations. • Urban hot-spots probably require further measures which may restrict mobility. • More research needed (by Atmos Physics post-docs).
But… • Of 2.9 billion living in cities around the world 2 billion in ‘less developed’ regions (UN,1999); majority of worst polluted cities in Asia • Vehicle emission control technology is expensive • Cooking and small fires major sources • Many cities are less windy than UK cities • Many cities in arid/semi-arid areas – affected by natural dusts • 2-5% of all deaths in urban areas caused by air pollution. • Demand for transport growing much faster than ever happened in Europe.