Download
1 / 89
890 likes | 1.07k Views
IDEAL URBAN HYDROLOGY, SEDIMENTOLOGY AND WATER QUALITY SPREADSHEET MODEL. Greenville County Greenville, SC August 22, 2002 Billy J. Barfield John C. Hayes. Pervious. Modeling Framework For Watershed. Pervious and Unconnected Impervious. Directly Connected Impervious. Impervious.

E N D
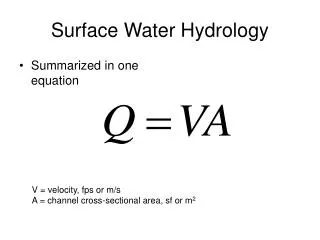
IDEAL URBAN HYDROLOGY, SEDIMENTOLOGY AND WATER QUALITY SPREADSHEET MODEL Greenville County Greenville, SC August 22, 2002 Billy J. Barfield John C. Hayes
Pervious Modeling Framework For Watershed Pervious and Unconnected Impervious Directly Connected Impervious Impervious Veg Buffer/ Filter Veg Buffer/ Filter Imp Dry/Wet Detention Basin Outflow From Watershed
GENERAL APPROACH • Each element is modeled with approximations to state-of-the-art procedures • In many cases, used generated data to develop explicit prediction equations that match more complex trial and error procedures
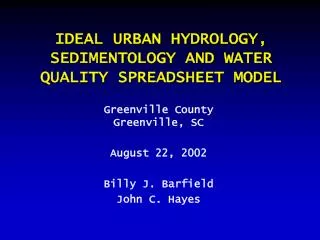
RAINFALL INPUTS • Rainfall is driving force • Amount of runoff for a given rainfall depends on • Soil • Cover • Antecedent moisture which depends on season and recent rainfall • Model develops predictions for an average storm, using statistical averages
Precip Amount Prob P Growing Season Dormant Season Prob GS Prob DS AMC 1 AMC 1 AMC 2 AMC 2 AMC 3 AMC 3 Prob A1 Prob A1 Prob A2 Prob A2 Prob A3 Prob A3 Modeling Rainfalland Antecedent Moisture 12 Storms 0.25’’ to 10.5’’
Precip Amount Prob P Dormant Season Growing Season Prob DS Runoff Runoff Runoff Runoff Runoff Prob GS Sediment Sediment Sediment Sediment Sediment Nutrients Nutrients Nutrients Nutrients Nutrients Pathogens Pathogens Pathogens Pathogens Pathogens AMC 2 AMC 3 AMC 2 AMC 1 AMC 1 AMC 3 Prob A1 Veg Buffers Veg Buffers Veg Buffers Veg Buffers Veg Buffers Veg Buffers Prob A2 Prob A2 Prob A3 Prob A3 Prob A1 Dry/Wet Detention Dry/Wet Detention Dry/Wet Detention Dry/Wet Detention Dry/Wet Detention Dry/Wet Detention Rainfall Interactions With Runoff, etc Runoff Sediment Nutrients Pathogens
Precip Amount Prob P Modeling Rainfall 12 Storms 0.25’’ to 10.5’’
Looking At Rainfallon theSpreadsheet Located in the Storm Data Worksheet Not Viewed by User
Modeling Rainfalland Antecedent Moisture Condition (AMC) • Runoff for a given rainfall depends on antecedent moisture • Rainfall required for a given antecedent moisture depends on season • Developed probabilities for rainfall occurring in a given season and for a given AMC
Precip Amount Prob P Growing Season Dormant Season 0.664 0.336 AMC 1 AMC 1 AMC 2 AMC 2 AMC 3 AMC 3 0.797 0.543 0.104 0.231 0.100 0.226 Modeling Rainfalland Antecedent Moisture
Precip Amount Prob P Dormant Season Growing Season Prob DS Prob GS AMC 2 AMC 3 AMC 2 AMC 1 AMC 1 AMC 3 Prob A1 Prob A2 Prob A2 Prob A3 Prob A3 Prob A1 Modeling Runoff Runoff
Runoff Inputs • Areas and Land Use • Hydrologic Parameters • Curve Number for each land use • Time of concentration for each area
Pervious Modeling Framework For Watershed Pervious and Unconnected Impervious Directly Connected Impervious Impervious Imp
MODELING RUNOFFVolume NRCS Curve Number Method Curve Number Depends on Land Use, Hydrologic Soil Group, and Antecedent Moisture
Looking At Runoffon theSpreadsheet Located in the Qqp Worksheet Not Viewed by User
( ) Information Only
MODELINGPEAK DISCHARGE NRCS TR55 Method Q = Runoff Volume (in) Aw = Area (mi2) Qu given in graphical form, but was parameterized for this model
Looking At Peak Dischargeon theSpreadsheet Located in the Qqp Worksheet
MODELING SEDIMENT YIELD:Pervious Areas MUSLE The MUSLE is only used for pervious areas.
MODELING SEDIMENT YIELD:Impervious Areas • EMC varies with type of impervious area • Modeling dependability improves as local data is collected EMC Approach
Looking At Sediment Yieldon theSpreadsheet Located in the Sediment Concentration, Sediment Yield, And TrappingWorksheet
MODELING SEDIMENT SIZE DISTRIBUTION • Size determines sediment trapping in VFS and in pond • Nutrients and bacteria are absorbed on the exchange phase of the clay particles, hence need to know concentration of clay size particles Why is it important?
MODELING SEDIMENT SIZE DISTRIBUTION • Primary - basic clay, silt and sand broken down to the single particles • Aggregates - particles made of multiple primary particles bonded together by clay or organic matter • Both are present in eroded material from pervious areas • Only primary particles are assumed to be washed from impervious areas Types of Particles in Eroded Sediment
Model Uses the CREAMS Equations to predict fraction of particles in the following size classes: MODELING ERODED SEDIMENT SIZE DISTRIBUTION: Pervious Areas • Predictions are based on fractions of original silt, sand and clay in the parent soil
MODELING PERCENT CLAY IN ERODED PARTICLES: Pervious Areas • Aggregates contain clay particles used to cement the silt and sand particles together • Model Uses the CREAMS Equations to predict fraction of clay in the aggregates:
MODELING SEDIMENT SIZE DISTRIBUTION:Impervious Areas • Based on data from NURP study, have the following input values:
Looking At Eroded Size Distributionon theSpreadsheet Located in the Ero Prtcle SizeWorksheet
MODELING NUTRIENTS • Yield based on event mean concentrations (EMCs) for each chemical • EMCs vary slightly based on land use • Total Phosphorus ~ 0.1 - 0.4 mg/l • Total Nitrogen ~ 1.6 - 2.0 mg/l
MODELING INDICATOR BACTERIA • Yield based on event mean concentrations (EMCs) for bacteria • EMCs highly variable • National average ~ 15000 number/100ml • Depends a great deal on presence of wildlife, leaky sewers, etc
Looking At Nutrient And Bacteria Generation Calculations on Spreadsheet Located in thePolnt Ldng & Trpng Worksheet
Pervious Modeling the Impact of Buffer Strips/VFS Pervious and Unconnected Impervious Directly Connected Impervious Impervious Veg Buffer/ Filter Veg Buffer/ Filter Imp
Inflow Rate I Outflow Rate V df FLOW HYDRAULICS IN VFS Infiltration Rate Flow Velocity Flow Depth The important hydraulic parameters
Hydraulic Inputs for VFS • Type vegetation • Roughness (Manning’s n) • Density Ss (spacing of vegetated media) • Slope S (ft/ft) • Infiltration rate (iph)
Hydraulic Calculations for VFS • Velocity - Manning’s Equation • Equations are solved to determine velocity V and depth of flow df
Hydraulic Calculations for VFS • Infiltration and Outflow Volume • Peak inflow rate modified for reduction in flow volume to get peak outflow rate, using triangular hydrograph approximation
Looking At Flow Through Filter Strip on Spreadsheet Located in the VFS Hyd & SedWorksheet
Sediment Trapping in VFS Tei= Trap eff for particle i Re=Reynolds Number Nf=Fall Number Rs=Spacing Hyd Radius Vs=Partcle Settling Velocity =Fctn (particle dia) Lf=Flow Length df=Flow Depth V=Flow Through Velocity • Trapping by settling