Download
1 / 28
280 likes | 819 Views
Effect Size Estimation in Fixed Factors Between-Groups Anova. Contrast Review. Concerns design with a single factor A with a 2 levels (conditions) The omnibus comparison concerns all levels (i.e., df A > 2) A focused comparison or contrast concerns just two levels (i.e., df = 1)

E N D
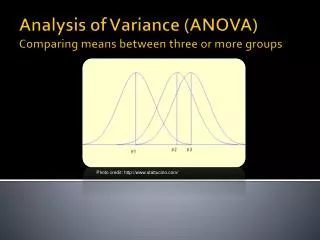
Effect Size Estimation in Fixed Factors Between-Groups Anova
Contrast Review • Concerns design with a single factor A with a 2 levels (conditions) • The omnibus comparison concerns all levels (i.e., dfA> 2) • A focused comparison or contrast concerns just two levels (i.e.,df = 1) • The omnibus effect is often relatively uninteresting compared with specific contrasts (e.g., treatment 1 vs. placebo control) • A large omnibus effect can also be misleading if due to a single discrepant mean that is not of substantive interest
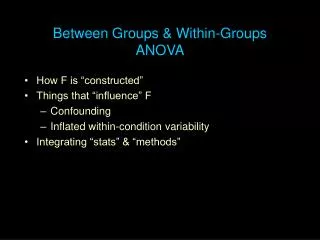
Comparing Groups • Traditional approach is to analyze the omnibus effect followed by analysis of all possible pairwise contrasts (i.e. compare each condition to every other condition) • However, this approach is typically incorrect (Wilkinson & TFSI,1999)—for example, it is rare that all such contrasts are interesting Also, use of traditional methods for post hoc comparisons (e.g. Newman-Keuls) reduces power for every contrast, and power may already be low
Contrast specification and tests • A contrast is a directional effect that corresponds to a particular facet of the omnibus effect often represented with the symbol y for a population or yˆ for a sample a weighted sum of means • In a sample, a contrast is calculated as: • a1, a2, ... , aj is the set of weights that specifies the contrast • As we have mentioned • Contrast weights must sum to zero and weights for at least two different means should not equal zero • Means assigned a weight of zero are excluded from the contrast • Means with positive weights are compared with means given negative weights
Contrast specification and tests • For effect size estimation with the d family, we generally want a standard set of contrast weights • In a one-way design, the sum of the absolute values of the weights in a standard set equals two (i.e., ∑| aj | = 2.0) • Mean difference scaling permits the interpretation of a contrast as the difference between the averages of two subsets of means
Contrast specification and tests • An exception to the need for mean difference scaling is for trends (polynomials) specified for a quantitative factor (e.g., drug dosage) • There are default sets of weights that define trend components (e.g. linear, quadratic, etc.) that are not typically based on mean difference scaling • Not usually a problem because effect size for trends is generally estimated with the r family (measures of association) • Measures of association for contrasts of any kind generally correct for the scale of the contrast weights
Orthogonal Contrasts • Two contrasts are orthogonal if they each reflect an independent aspect of the omnibus effect • For balanced designs and unbalanced designs (latter)
Orthogonal Contrasts • The maximum number of orthogonal contrasts is dfA = a − 1 • For a set of all possible orthogonal pairwise contrasts, the SSA = the total SS from the contrasts, and their eta-squares will sum to the SSA eta-square • That is, the omnibus effect can be broken down into a − 1 independent directional effects • However, it is more important to analyze contrasts of substantive interest even if they are not orthogonal
Contrast specification and tests • t-test for a contrast against the nil hypothesis • The F is
Dependent Means • Test statistics for dependent mean contrasts usually have error terms based on only the two conditions compared—for example: • s2here refers to the variance of the contrast difference scores • This error terms do not assume sphericity, which we’ll talk about more with repeated measures design
Confidence Intervals • Approximate confidence intervals for contrasts are generally fine • The general form of an individual confidence interval for Ψis: • dferror is specific to that contrast
Contrast specification and tests • There are also corrected confidence intervals for contrasts that adjust for multiple comparisons (i.e., inflated Type I error) • Known as simultaneous or joint confidence intervals • Their widths are generally wider compared with individual confidence intervals because they are based on a more conservative critical value • Program for correcting • http://www.psy.unsw.edu.au/research/resources/psyprogram.html
Standardized contrasts • The general form for standardized contrasts (in terms of population parameters)
Standardized contrasts • There are three general ways to estimate σ (i.e., the standardizer) for contrasts between independent means: • 1. Calculate d as Glass’s Δ • i.e., use the standard deviation of the control group • 2. Calculate d as Hedge’s g • i.e., use the square root of the pooled within-conditions variance for just the two groups being compared • 3. Calculate d as an extension of g • Where the standardizer is the square root of MSWbased on all groups • Generally recommended
Standardized contrasts • Calculate from a tcontrast for a paper not reporting effect size like they should • Recall the weights should sum to 2
CIs • Once the d is calculated one can easily obtain exact confidence intervals via the MBESS package in R or Steiger’s standalone program • The latter will provide the interval for the noncentrality parameter which must then be converted to d
Cohen’s f • Cohen’s f provides what can interpreted as the average standardized mean difference across the groups in question • It has a direct relation to a measure of association • As with Cohen’s d, there are guidelines regarding Cohen’s f • .10, .25, .40 for small, moderate and large effect sizes • These correspond to eta-square values of: • .01, .06, .14 • Again though, one should conduct the relevant literature for effect size estimation
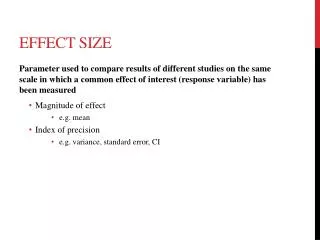
Measures of Association • A measure of association describes the amount of the covariation between the independent and dependent variables • It is expressed in an unsquared metric or a squared metric—the former is usually a correlation, the latter a variance-accounted-for effect size • A squared multiple correlation (R2) calculated in ANOVA is called the correlation ratio or estimated eta-squared (2)
Eta-squared • A measure of the degree to which variability among observations can be attributed to conditions • Example: 2 = .50 • 50% of the variability seen in the scores is due to the independent variable.
More than One factor • It is a fairly common practice to calculate eta2(correlation ratio) for the omnibus effect but to calculate the partial correlation ratio for each contrast • As we have noted before SPSS calls everything partial eta-squared in it’s output, but for a one-way design you’d report it as eta-squared
Problem • Eta-squared (since it is R-squared) is an upwardly biased measure of association (just like R-squared was) • As such it is better used descriptively than inferentially
Omega-squared • Another effect size measure that is less biased and interpreted in the same way as eta-squared • So why do we not see omega-squared so much? • People don’t like small values • Stat packages don’t provide it by default
Omega-squared • Put differently
Omega-squared • Assumes a balanced design • eta2 does not assume a balanced design • Though the omega values are generally lower than those of the corresponding correlation ratios for the same data, their values converge as the sample size increases • Note that the values can be negative—if so, interpret as though the value were zero
Comparing effect size measures • Consider our previous example with item difficulty and arousal regarding performance
Comparing effect size measures Slight differences due to rounding, f based on eta-squared
No p-values • As before, programs are available to calculate confidence intervals for an effect size measure • Example using the MBESS package for the overall effect 95% CI on ω2: • .20 to .69
No p-values • Ask yourself as we have before, if the null hypothesis is true, what would our effect size be (standardized mean difference or proportion of variance accounted for)? • 0 • Rather than do traditional hypothesis testing, one can simply see if our CI for the effect size contains the value of zero (or, in eta-squared case, gets really close) • If not, reject H0 • This is superior in that we can use the NHST approach, get a confidence interval reflecting the precision of our estimates, focus on effect size, and de-emphasize the p-value