Effect Size
Effect Size. What it is and what it ain’t. Consider Quine. “Now if objective reference is so inaccessible to observation, who is to say on empirical grounds that belief in objects of one or another description is right or wrong?” - W.V. Quine, Word and Object, 1960 -.

Effect Size
E N D
Presentation Transcript
Effect Size What it is and what it ain’t
Consider Quine • “Now if objective reference is so inaccessible to observation, who is to say on empirical grounds that belief in objects of one or another description is right or wrong?” • - W.V. Quine, Word and Object, 1960 -
What’s wrong with NHST? • Many say that the biggest problem is Type II error • For me, the problem is that it represents a very low bar
If you can’t achieve stat sig… • One of two things is probably true • Either there really isn’t an effect • Or your design is fatally flawed • Either way, it’s back to the drawing board
If you can achieve stat sig… • Then you know that your result probably wouldn’t have occurred if the null were true, i.e., statistical significance • But you still need to know whether your result passes the So What test • It is here that effect size is useful
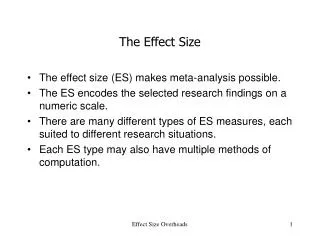
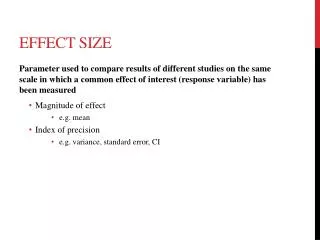
Defining effect size • An effect size is a standardized index of the magnitude of the relationship between variables • “standardized” means that effect sizes are independent of scale of measurement and are therefore comparable across studies • Although an unstandardized index is possible (e.g., a covariance), standardized indices (e.g., r) are generally more useful for interpretation
An example • 30 managers were given frame of reference training prior to completing their appraisals of the performance of their subordinates • 30 other managers were given no training • Descriptives were as follows
Trained group Control Results
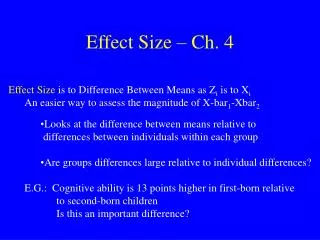
Which means The performance appraisals of the trained group were .5 standard deviations higher than the appraisals of the control group Note that the d value would also be .5 if the N’s were 300, or 3000, or 300,000
Compare this to t Where the denominator is the standard error of the difference between means Thus, t=1.94.which is just below significance with 2-tailed .05 If N’s were 300, t=6.13, and if N’s were 3000, t=almost 20
Many other effect size indices • r2 is the % of variance in one variable accounted for by another • R2 is % of variance in one variable accounted for by a weighted composite of a set of variables • R2model is the % of variance in all DV’s in a model accounted for by the variables hypothesized to affect them • η2 is the ANOVA version of r2, or the ratio of SSeffect to SStotal • All of these are scale-free and, therefore, interpretable across studies
How are effect sizes interpreted? • Depends largely on context • r2=.10 is pretty good if between a self-report indiv. difference variable and supervisory perf. ratings • .10 stinks if between two items intended to measure the same construct • .10 is enormous if it represents the change in R2 associated with the addition of a product term
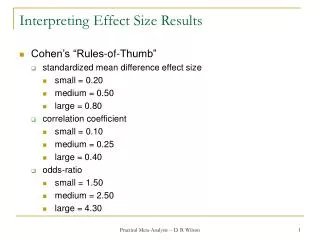
With regard to d • Cohen suggested that • d≤.20 be considered “small” • .20≤ d ≤.8 be considered “medium” • >.8 be considered “large” These are arbitrary, but seldom qualified in stats texts
What to do • Report appropriate effect sizes, period • If sample size is large, don’t bother with NHST • If sample size is relatively small, conduct NHST in order to evaluate chance as an explanation
If N is small, cont’d • Consider the N1=N2=30 example • d must be larger than .5 for two-tailed .05 test to be significant • I should NOT dismiss the data simply because p>.05 • Language that I use will depend on the nature of the variables involved (also true if N is large)
When “small” effects tell a big story • Suppose that my training program • Was inexpensive to develop • Required one hour to administer • Generated d of .5 for performance appraisals conducted six months after the training
.50 is huge!!!! • Because it was generated with an inexpensive training program • Because it was generated in a transfer model with 6-month lag • Because the training program represented a minimal manipulation
What if, instead • The training program cost 5% of annual revenue to develop • Required several trainers to administer • Required 2 weeks per trainee • Generated d=.5 on immediate trainee reactions
d=.50 sucks (technical term) • Because it was generated with an expensive training program • Because it was generated in a reactions model with no time lag • Because the training program represented a strong manipulation
Consider some other examples • Tajfel’s minimal groups studies • Wilson’s work on exposure and liking • Asch’s peer pressure studies • Physical attraction and jury decisions, preference of experts for their own global judgments, relationship between social structure and suicide • All of these have in common some form of “inauspicious design”
Consider yet other examples • The correlation between aspirin consumption and heart attack occurrence is .03 • Skill (defined as previous success) of MLB players explains less than 1% of variance in getting on base in a given at bat • In these examples, the consequences of the manipulation are obscured
And yet others • Milgram’s obedience studies • Judge’s work predicting OCB and deviant behavior from personality and attitudes • Our work predicting OCB from knowledge and skill • These studies turn fundamental assumptions on their ear
When big effects are no big deal • Suppose that d=1.0 in a study of the relationship between smoking and CVD • Consider the study of the two-week training program • Results of extreme groups designs must be interpreted with caution
So how can I tell what language to use? • There is no single prescription • The language that you use depends on the context in which the data were generated • There are many factors that relax the pressure on data. If those factors are present, then the data requirements for statements like “Support was found…” are fewer.
The bottom line • Report appropriate effect sizes and NHST (unless you want the reviewers to wonder why you don’t report them) • There is an art to choosing conclusion language that is flattering to the theory while remaining consistent with the facts. • Choose your words carefully, and be sure that they reflect all relevant analyses as well as the context in which the data were collected