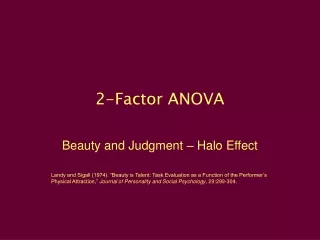
Two-Factor ANOVA: Graphs, Hypothesis Tests, Formulas
Learn about Two-Factor ANOVA, testing teaching programs & class sizes with data, graphs, hypothesis tests, and variance formulas.

Two-Factor ANOVA: Graphs, Hypothesis Tests, Formulas
E N D
Presentation Transcript
F formula Variance (differences) between sample means F = Variance (differences) expected from sampling error
Graph of Means 10 8 No Audience Mean Number of Errors 6 Audience 4 2 High Low
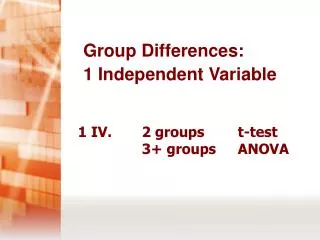
Single Factor ANOVA vs. 2 Factor ANOVA Single Independent Variable Dependent Variable Single Factor - One-way ANOVA Now: Two Independent Variables Dependent Variable Two Factor ANOVA
Two-factor analysis of variance permits us to test: • Mean difference between the 2 teaching programs • Mean differences between the 3 class sizes • Combinations of teaching program and class size
Three separate hypothesis tests in one ANOVA Three F-ratios: Variance (differences) between sample means F = Variance (differences) expected from sampling error
Hypotheses for Teaching program Factor A Teaching Program (Teaching program has no effect on math scores) (Teaching program has an effect on math scores) Variance (differences) between treatment means for Factor A F = Variance (differences) expected from sampling error
Hypotheses for Class Size Factor B Class Size (Class size has no effect on math scores) At least one population mean is different (Class size has an effect on math scores) Variance (differences) between treatment means for Factor B F = Variance (differences) expected from sampling error
90 Graphs of Math Test Score Means 85 80 75 Program I Mean math test scores 70 Program II 65 60 30 Students 24 Students 18 Students 90 85 Program I 80 Mean math test scores 75 70 65 Program II 60 18 Students 24 Students 30 Students
Thus two-factor AVOVA composed of 3 distinct hypothesis tests: • The main effect of A (called the A-effect) • The main effect of B (called the B-effect) • The interaction (called the AxB interaction)
(a) Data showing a main effect for factor A, but no B-effect and no interaction 10-point difference No difference
(b) Data showing a main effects for both factor A and factor B, but no interaction 10-point difference 20-point difference
(c) Data showing no main effect for either factor A or factor B, but an interaction No difference No difference
Null and Alternate Hypotheses for an Interaction Interaction H0 : There is no interaction between factors A and B. H1 : There is an interaction between factors A and B. OR H0 : The effect of factor A does not depend on the levels of factor B (and B does not depend on A). H1 : The effect of one factor does depend on the levels of the other factor (and B does not depend on A). Variance (differences) not explained by main effects F = Variance (differences) expected from sampling error
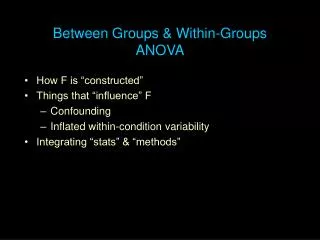
Differences in Variabiltiy Between Treatment Variability • Treatment (factor A, B, or AxB interaction) • Individual differences (difference of SS in each treatment condition) • Experimental error Variability Within Treatments (Chance) • Individual differences • Experimental error Treatment effect + Individual Differences + Experimental Error F = Individual Differences + Experimental Error
Breakdown of Variability Sources Total Variability Stage 1 Between-treatments Variability Within-treatments Variability Stage 2 Factor A Variability Factor B Variability Interaction Variability
2 - Factor Data Table N = 30 G = 90 ∑x2 = 520
2 - Factor Data Table w/ Cell Means N = 30 G = 90 ∑x2 = 520
2 - Factor Data Table w/ Cell Means & Marginal Means N = 30 G = 90 ∑x2 = 520
Total Between Treatments Within Treatments Factor A Factor B Breakdown of Variability Sources and Formulas Stage 1 Stage 2 Interaction SS found by subtraction = 80
Breakdown of Degrees of Freedom and Formulas Total df = N - 1 = 29 Stage 1 Between Treatments df = ab - 1 = 5 Within Treatments df = N - ab = 24 Stage 2 Factor A df = a - 1 = 1 Factor B df = b - 1 = 2 Interaction df = dfA x dfB = 2
Total df = N - 1 Breakdown of both Degrees of Freedom and SS Formulas Stage 1 Between Treatments df = ab - 1 Within Treatments df = N - ab Stage 2 Factor A df = a - 1 Factor B df = b - 1 Interaction SS is found by subtraction df = (a - 1)(b - 1)
2 F-ratio distributions Distribution of F-ratios df = 1.24 0 1 2 3 4 5 6 4.26 Distribution of F-ratios df = 2.24 0 1 2 3 4 5 6 3.40
Plot of the mean scores of Factor A and B 7 6 5 Mean score 4 3 A1 2 1 A2 0 B1 B2 B3 Factor B
Schacter (1968)Obesity and Eating Behavior • Hypothesis: obese individuals do not respond to internal biological signals of hunger
Variables • 2 Independent Variables or Factors • Weight (obese vs. normal) • Fullness (full stomach vs. empty stomach) • Dependent Variable • Number of crackers eaten by each subject
Weight vs. Fullness G = 1440 x2 = 31,836 N = 80
Plot of mean number of crackers eaten for each group 23 Mean Number of Crackers Eaten 22 21 20 19 Mean Number of Crackers Eaten Obese 18 17 16 Normal 15 14 Empty Stomach Full Stomach
The means and standard deviations are presented in Table 1. The two-factor analysis of variance showed no significant main effect for the weight factor, F(1,76) = 0.28, p > .05; no significant main effect for the fullness factor, F(1,76) = 2.54, p > .05; but the interaction between weight and fullness was significant, F(1,76) = 4.51, p < .05. Conclusion to Weight vs. Fullness Problem TABLE 1
Assumptions for the 2-factor ANOVA:(Independent Measures) • Observations within each sample are independent • Populations from which the samples are drawn are normal • Populations from which the samples are selected must have equal variances (homogeneity of variance)