Download
1 / 20
200 likes | 381 Views
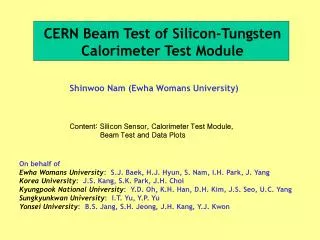
CERN Beam Test of Silicon-Tungsten Calorimeter Test Module. Shinwoo Nam (Ewha Womans University). Content: Silicon Sensor, Calorimeter Test Module, Beam Test and Data Plots.

E N D
CERN Beam Test of Silicon-Tungsten Calorimeter Test Module Shinwoo Nam (Ewha Womans University) Content: Silicon Sensor, Calorimeter Test Module, Beam Test and Data Plots On behalf of Ewha Womans University: S.J. Baek, H.J. Hyun, S. Nam, I.H. Park, J. Yang Korea University: J.S. Kang, S.K. Park, J.H. ChoiKyungpook National University: Y.D. Oh, K.H. Han, D.H. Kim, J.S. Seo, U.C. YangSungkyunkwan University: I.T. Yu, Y.P. YuYonsei University: B.S. Jang, S.H. Jeong, J.H. Kang, Y.J. Kwon
Silicon Sensor (Pixellated PIN Diode) 20um 60um Pixels(Signal) Guard Ring SiO2 p+ 380㎛ N-type silicon wafer of 5 ㏀ Al • Fabricated on 380um 5’ wafer • A Sensor Size : 6.52*5.82 cm2 (including 3 guard rings ) • Pixel array : 4*4 matrix • 1.55 * 1.37 cm2 each • DC coupled • Full depletion voltage : 90V • Leakage current level : about 3 nA per pixel at full depletion voltage 3 Guard Rings
Clean wafer Oxidation N+Diffusion Cover with photoresist Expose through mask Develop Etch, Stip P+ImplantationAnneal Metallization Process of Silicon Fab, Sawing, Bonding Wafer -> Fabricated PIN diode matrix Mass Production Fabrication made at SENS Technology (www.senstechnology.co.kr) Sawing / attach Kapton tape Kapton tape has patterned Cu wiring(50um) on it for readout Wire bonding For wire boning to the diode pixel, Al wire with diameter 25 um was used. Recently we added one more wire to reduce risk of bonding failure Glob Top (DCE, DP100) For protection of bonded wire. It is important to put the glob top in Vacuum to remove the air bubbles in glue. Fabrication process
Capacitance Measurement 1/c2 Full depletion voltage for 5kOhm wafer sensor: about 85-90V Applied 100V because of variation in the thickness and resistivity of wafers
Leakage Current Measurement (10nA) ~3nA per pixcel at full depletion voltage ! Close to 90% yieldwith quality cut of 20nA/pixel at 100V !
Dark box sensor Photodiode Pb Pb Beta (90Sr) source S/N Ratio Measurement with Sr-90 source(use of single channel very low noise preamp) Trigger Photodiode Discriminator GateGenerator ShapingAMP S/N ~ 120 PreAmp PreAmp for sensor
16 pixels ADC Frontend Readout with CR1.4 chip Gain Linearity Test Using charge calibration Function of chip • Developed for the Pamela Experiment • 16 channels of charge inputs (integrating the charge pulses -> DC levels) • Gain: 1mV/fC • Dynamic Range: to 4000 MIPs • up to 150 pF capacitance with leakage currents as high as 100 nA. It measures charge from 2.2 fC to 9 pC. • Noise ~ 5000 e • Power: 0.3 mW/ch • The outputs of the T/H circuits are multiplexed to a common output buffer that is capable of driving a load of 1k and 100 pF. • The output of the chip swings from -3V to 4V CR1.4 chip handles a 16-ch Si sensor PCB Ladder Prototype
Digital Electronics : ADC, Contorl, Power Board • ADC: MAX 1133 • Sampling Speed : 200ksps • (200ksps X 16bit = 0.4Mbyte/s) • Resolution : 16bit (65536 Level) Power Control DC Voltage High Voltage FPGA DAQ board Frontend Board ACP Board ADCs PC
Integration Test of Electronics and DAQ readout speed : 0.1 msec for full readout ADC : 16 bits Data IO, Command, Calibration Boards ADC, Control Board Total 640 readout channels
Tungsten and Mechanics thickness : 3.5 mm (= 1 X0) Size 65.5 mm X 57.5 mm ( ~ sensor size) Tungsten Test Module : 20 layers stacked Frontend board Mount holes Aluminum Support of a Layer
Aluminum 1.5 mm Sensor and Readout 10 mm Tungsten 3.5 mm 15 mm Thickness of an Assembled Layer Connector 2.7 mm Capacitor 1.4 mm Pcb 1.7 mmResistor 0.65 mm Diode 1.15 mm CR 1.4 chip 2.45 mm Shielding board 1mm 1mm inactive gap between sensors Silicon Sensor 32 pixels in a layer 131mm X 115mm Frontend Board
Layers of Si sensors and Tungstens Digital and Control Boards Frontend readout boards Beam Direction
Summary of Our Test Module Geometry • Total 20 layers = 20X with uniform layer thickness • Shower sampling at 19 layers with 2 sensors each layer. • 1mm gap between sensors • Aligned beam center to the center of a sensor 1mm inactive gap Effective RM :~ 45mm from volume ration of material RM 131mm X 115mm -> insufficient transverse shower containment 100GeV No action taken for cooling the frontend. Temperature level during test ~35 to 40 deg Geant4 Simulation 50GeV 10GeV W Layer Number
CERN Beam Test Steps of Beam Test 1. Tune trigger time delay 2. Align detector by using movable table under the our detector 3. MIP calibration of all channels (using hadron beam (less spread) after removing all tungstens) 4. Data Run (electron 150,100,80,50,30,20,10 GeV hadron 150 GeV muon 150 GeV) random trigger mixed in the runs for pedestal monitor beam Thanks A. Malinine for the test beam line control Beam Test : CERN SPS H2 beam line for a week till Sep. 7 2004 Beam cycle 18.0 sec with 4.8 sec spill time beam line focus & existing trigger scintillators give beam spread of ~1 cm diameter Beam focus worse in muon beam
Channel Scan for MIP calibration Scanned over all 640 channels with 100 GeV hadron Beam (no tungsten) Pedestal : Gaussian Fit Mean : 5206.9 Sigma : 7.2 Signal : Landau Fit Peak : 5243 an example of a sensor with all good pixels S/N = 5.2 ADC Counts
Detector Response to Different Particles Random Trigger events (total pedestal) 50 GeV Electron Online Shower Profile Monitor Pedestal subtracted 50 GeV pion First Analysis : sum ADC counts of all channels No rejection of dead, noisy channels, No gain calibration applied 150 GeV Muon Total ADC of an event / 640
Detector Response to Different e- Energy Shower 150 GeV 100 GeV 80 GeV Readout Pedestals from Random Trigger 50 GeV 30 GeV 20 GeV 10 GeV Total ADC of an event / 640
Calorimeter Calibration Preliminary Total ADC above pedestal / 640 Straight Fit Line 1GeV <--> 4.2 * 640 ADC Counts Linear response, No saturation Electron Energy in GeV
Energy Resolution Preliminary • Geant4 simulation of this setup taking into account only shower leakage gives 18%/√E. • The effect of bad channels, gain calibration, and beam spread are not included here. • Working on further analysis Fit curve of 29%/√E dE / E (%) Electron Energy in GeV
Summary and Remarks • We have an experience on successful design and production of Si Pixel sensors • shows the yield close to 90% and better than the expectation • excellent Si sensors, typically Id =10nA/cm2 • Si-W Test Module for LC was built and exposed to the CERN beams ‘2004 • Preliminary result 28%/√E, (MC 18%/√E without taking into account of • Noisy channels (~10%) • ADC unstable(~10%) • Deal channels (~2%) • Gain calibration • Beam spread • The cost of Silicon is down to $5/cm2, hope to down to less than $2/cm2 • Prototype-II design with thinner layers and AC-coupled sensors is in progress