7.4 DV’s and Groups
150 likes | 301 Views
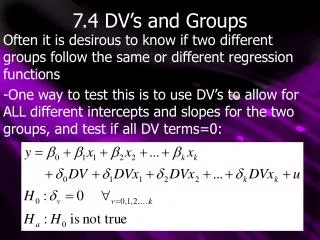
7.4 DV’s and Groups. Often it is desirous to know if two different groups follow the same or different regression functions -One way to test this is to use DV’s to allow for ALL different intercepts and slopes for the two groups, and test if all DV terms=0:. 7.4 DV’s and Groups.

7.4 DV’s and Groups
E N D
Presentation Transcript
7.4 DV’s and Groups Often it is desirous to know if two different groups follow the same or different regression functions -One way to test this is to use DV’s to allow for ALL different intercepts and slopes for the two groups, and test if all DV terms=0:
7.4 DV’s and Groups As we’ve already seen in our discussion of F tests, the significance or insignificance of one variable is quite separate from the joint significance of a set of variables -Therefore an F test must be done using the restricted model: However, in the case of many x variables, this results in a large number of interaction variables, and may be difficult
7.4 DV’s and Groups Alternately, one can run the regression in question (without DV’s) for the first and second group, and record SSR1 and SSR2 -a full regression is then run with all observations included to find SSRp -a test F statistic is then formed as: Which is usually called the CHOW STATISTIC and is only valid under homoskedasticity
7.4 DV’s and Groups This F value is compared to F* from our tables with k+1, n-2(k+1) degrees of freedom -Note that no valid R2 form of this equation exists -the null hypothesis as listed allows for no difference between groups -if it is not rejected, the two groups test statistically identical (at a certain α) -if one wants to allow for an INTERCEPT difference in the two groups, the full regression is run with a single DV to distinguish the groups
7.5 Binary Dependent Variables -Thus far we have only considered QUANTITATIVE values for our dependent variable, but we can also have dependent variables analyzing a QUALITATIVE event -ie: failing or passing the Midterm -in the simplest case, y has 2 outcomes -ie: MT=1 if passed, =0 otherwise
7.5 Binary Dependent Variables -Here our y value reflect the probability of “success”, that is, -This is also called the RESPONSE PROBABILITY -Since probabilities must sum to one, we also have that -the regression with a binary dependent variable is also called the LINEAR PROBABILITY MODEL (LPM)
7.5 Binary Dependent Variables -in the LPM, Bj can no longer be interpretted as the change in y given a one unit change in x. Instead, -Our estimated regression becomes: -Where yhat is our predicted probability of “success” and Bjhat predicts the change in the probability of success due to a one unit increase in xj
7.5 Binary Example -Assume that our above example regressed as: -This reflects some LIMITATIONS of the LPM: • If bribe (expressed in tens of thousands of dollars)=100 ($1 million), then MThat>4 (400% chance of passing). Ie: estimated probabilities can be negative or over 1. • This assumes that the probability increase of the first hour of studying (1%) is the same as the probability increase of the 49th hour (1%).
7.5 LPM Fixing -One way around this is to redefine predicted values: -One advantage of this redefinition is we can obtain a new goodness-of-fit measure as PERCENT CORRECTLY PREDICTED -as now true and predicted values are both either zero and 1 -the number of matches over the number of observations is our goodness of fit
7.5 LPM and Heteroskedasticity -Because y is binary, the LPM does violate one Gauss-Markov assumption: -where p(X) is short for the probability of success -therefore, heteroskedasticity exists and MLR.5 is violated -therefore t and F statistics are not valid until het is corrected as discussed in chapter 8
7.5 DV Party -It is also possible to include Dummy Variables as both the dependent variable and as independent variables, for example, -Where CheetSheet=1 if a cheat sheet is prepared, =0 otherwise -in this case the estimated coefficient of the independent DV gives the increase in probability of success if not the base case
7.6 Policy Analysis and Program Evaluation -Policy Analysis and Program Evaluation is generally done using the regression and hypothesis test: -Where the DV represents the group possibly needing a program or participation in the program -If H0 is not rejected, the program is not needed or is not effective
7.6 Evaluation and Analysis Difficulties This evaluation and analysis process has two inherent difficulties: • Omitted Variables -if a variable correlated with the DV is omitted, its estimated coefficient and test is invalid -due to past group discrimination, groups are often correlated with factors such as income, education, etc. 2) Self-Selection Problem -often participation in a program is not random
7.6 Omitted Example Consider the following equation: -Where we are testing whether midterm achievement is a function of which class section one is in -However, the choice of class can depend when you eat lunch (among other factors), which can affect Midterm achievement -Therefore by not including eating (which is correlated to our DV), our estimate is biased
7.6 Sample Selection Problems Program evaluation MUST assume that participation in the program or group (and thus inclusion in the control group) is random -however, people often CHOOSE inclusion or non-inclusion (ie: people choose to study, people choose to speed) -since these decisions are influences by parts of the error term, our OLS estimation is biased: Ie: one doesn’t study due to their drug (Survivor) addiction, something that they may not report and thus cannot be included in the regression