Download
1 / 4
40 likes | 315 Views
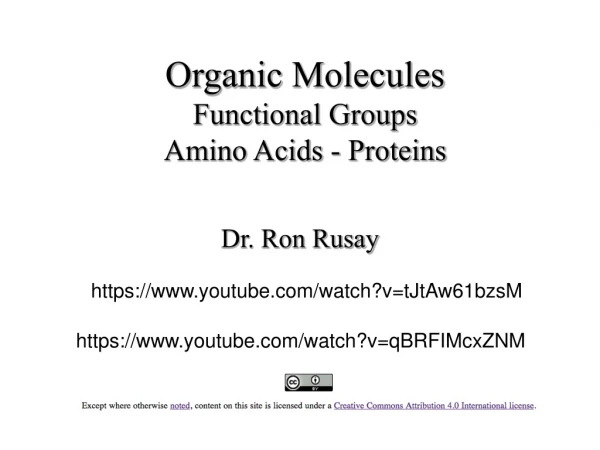
ESTIMATION OF AMINO GROUPS USING TNBS. REFERENCE: Fields, R. 1972. Methods in Enzymology . 25:464-469. Kris-itd.unair.ac.id (for education purpose only). MATERIALS : Solution A: 100mls of 0.1M Na 2 SO 3 (fresh each week) Solution B: 1.0l of 0.1M NaH 2 PO 4

E N D
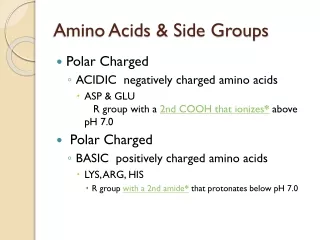
ESTIMATION OF AMINO GROUPS USING TNBS REFERENCE: Fields, R. 1972. Methods in Enzymology. 25:464-469. Kris-itd.unair.ac.id (for education purpose only)
MATERIALS : Solution A: 100mls of 0.1M Na2SO3 (fresh each week) Solution B: 1.0l of 0.1M NaH2PO4 Solution C: 1.0l of 0.1M Na2B4O7 in 0.1M NaOH (make up in acid and ddH2O- washed glass). Trinitrobenzene sulfonate (TNBS) 10g in 10ml H2O, heat to dissolve and remove black flecks of oil by centrifugation. Add HCl to 2M and cool to room temp. Wash the crystalline precipitate on a glass filter with 1M HCl. Desiccate and store at 4oC in brown bottle. Make up to 1.1M fresh daily (100mg recrystallized TNBS in 0.2ml H2O).
METHOD : make fresh daily Solution D: 1.5ml Solution A + 98.5ml Solution B standard curve: BSA at 0.1, 0.2, 0.5, 1.0, and 2.0 mg/ml in 0.25ml H2O. samples: same concentration range as above in same volume. add 0.25ml solution C add 10µl TNBS (take note of time!) Incubate exactly 5 min at 23oC. add 1ml solution D to stop reaction. measure OD420. Standard curve should range from about 0.09 to >1.8
CALCULATION : OD420 = 1.0 = 52nmol amino groups = 78nmol/1.5ml assay mix "1.0mg/ml" BSA sample (0.25mg) = OD420 of 0.945 = 73.41nmol NH3 therefore, 0.25 mmol BSA = 73.41 nmol NH3 groups 67,000 3.73nmol BSA = 73.41 nmol NH3 therefore 1 molecule BSA = 19.8 molecules of lysine.