Dependency Ratio
Dependency Ratio. Population Dependency Ratio The dependency ratio tells us how many young people (under 16) and older people (over 64) depend on people of working age (16 to 64). The dependency ratio is worked out with this formula:.

Dependency Ratio
E N D
Presentation Transcript
Population Dependency Ratio The dependency ratio tells us how many young people (under 16) and older people (over 64) depend on people of working age (16 to 64). The dependency ratio is worked out with this formula:
A worked example should make this clearer. Pakistan, which is a developing country, has 41% of its population less than 15, and 4% over 65. This makes 55% between the ages of 15 and 64.
New Zealand, a developed country, has 23% of its population less than 15, and 12% over 65. This makes 65% between 15 and 64.
Figure 3 is a plot of known and predicted old age dependency ratios for four MEDCs. It shows a ratio of around 25% in the UK in 2000. This means that, at present, there are about 25 pensioners for every 100 workers. However, the ratio is predicted to increase sharply after 2010, climbing to over 40% by 2040. Expressing this another way, the present ratio of 4 workers to support every pensioner is predicted to fall to 2.5 workers per pensioner by 2040.
THE GLOBALISATION OF AGEING From the outset, we need to be clear what is meant by an ‘ageing population’. It is simply one in which the balance between the ‘young’ (under 15- or 19-year olds) and the ‘elderly’ (over 60-year olds) components of a population shifts towards the latter. The latter does not necessarily have to be larger than the former. A shifting balance is the critical feature. Population Pyramids The basic cause of the change in pyramidal shape is simply a narrowing of the ‘gap’ between birth and death rates. The changes on a pyramid can be very obvious – you would see a narrow base and wide top. Think about a a pyramid for a country in stage 4 or 5 of the DTM. However, it can be much more subtle than this as illustrated by India.
In India’s case while the death rate will remain at 8/1000, the birth rate is forecast to fall from 22 to 17/1000. This will reduce the rate of natural increase from 1.4% to 0.9% per annum. As a consequence, the percentage of the population aged under-15 years will decrease from 31.2 to 17.2, while that for those aged over 60 years will rise from 7.5% to 11.8%.
Discussion • Is an ageing population just a characteristic of MEDCs today or is it a global phenomenon? • Does the ageing of a population raise the same issues, particularly so far as the elderly are concerned, no matter where you are in the world?
Any decline in the population growth rate means a general ageing of the population
AGEING POPULATION occurs when the median age of a country or region rises. With the exception of 18 countries this process is taking place in every country and region across the globe. The population of the world is ageing steadily, from 10% over 60 in 2005 to a projected 20% by 2050. As raw figures this is 670 million in 2005 to 2 billion in 2050. The increase in life expectancy and the decline in fertility has led to the median age of the population increasing. Ageing populations can be viewed as the result of technological and economic progress that has led to reductions in both birth and death rates.
Pensioners will soon outnumber children in Europe and North America for the first time. Much of the predicted increase in the numbers of the over-60s will be in the better developed LEDCs, particularly in Asia, where the problem of ageing populations is likely to become as great a concern to governments there in the near future as it is in MEDCs today.
Some facts about global ageing process In 2000 there was ? million people aged 60 and over. By 2025 this figure will be ? and by 2050 it will be ?. Soon one person in every three will be over the age of 60. 600 1.2 billion 2 billion
Where do you think the majority of the world’s oldest people live? Today about two-thirds of all older people are living in LEDCs (the developing world); by 2025 the figure will be three-quarters. Which age group in MEDCs do you think is the fastest growing? In MEDCs, the very old (aged 80+) is the fastest growing population group.
In 2002 7% of the world population was over 65 years old. Only 1% of the population of the United Arab Emirates was over 65 years old. China has the largest elderly population (92 million) but this is only 7% of the Chinese population. Growing proportions of elderly people are partly a result of people living longer and, often, of fewer births reducing the size of the younger population. Africa is home to only 6% of the world's population aged over 65
The % of those living over 65 is increasing , with 25% over 65 in Japan, Italy and Germany, but less than 5% in most tropical African countries.
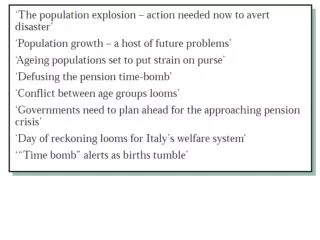
This summarises some key points. First, it underlines the basic fact that the ageing of any population is caused by a fall in either the birth or the death rate. A fall in both rates may be expected to accelerate the ageing. Secondly, when you look at the main factors shown as prompting both rates to fall, you will see that they are perhaps more evident and active in today’s LEDCs. That being the case, it is small wonder therefore that the ageing population is undergoing a spread from its pioneering core in Western Europe to many much less developed parts of the world.
Today the population of the UK which is >65 accounts for 16% of the total population. By 2033 this will be 23%, whilst that <16 will be 18%. Causes The policy response The impact of an ageing population What has been the impact of migration on the population structure of the UK between 2004 and 2008? Why might a government wish to encourage immigration to offset the effects of an ageing population? Do you agree with this? Use the Geofile on the VLE ageing population 2010
UK – An Ageing Population Create an ageing population in the UK. In 2010: ● only 16.5% of the UK’s population was aged 0-14 (compared with Uganda’s 50%). ● an almost equal proportion of the population was aged over 65 (compared with Uganda’s 2.1%). ● the UK’s median age was 40.5 – one of the highest in the world. Increasingly, however, older age groups are beginning to dominate the UK’s agesexstructure (Figure 5.22). This structure currently looks like Stage Four of the DTM, but it might soon look more like Stage Five if current population trends continue In 2010: ● the UK’s natural increase in population was just 0.7% a year – one of the world’s slowest. ● the birth rate was 10.7 per 1000. In many High Income Countries (HICs), including the UK, birth and fertility rates have been falling for decades. ● the death rate was 10 per 1000. It has fallen steadily over the last century. Life expectancy at birth in the UK is now almost 80. This is because of free universal healthcare via the NHS, improved treatment for the biggest causes of death (heart disease and cancer), and a better lifestyle due to increasing wealth. The falling fertility rate The UK’s fertility rate first fell below the replacement level of 2.1 in the 1970s. It has remained below that crucial level ever since. The drop in fertility rate has been partly caused by the improved status of women in British society. More women in the UK now go to university than men. As a result of this higher education, many women decide to pursue professional careers before marrying and having children in their thirties, rather than their twenties. Many of these women then continue their careers alongside raising a family. In 2005, the UK’s population reached the milestone figure of 60 million. By 2010, an extra 1.3 million people had already been added to that total. 61.3 million people – crowded into just under 250 000 square kilometres – means a population density of 243 people per square kilometre In 2009, the UK’s GDP per capita (PPP$) was $35 200 – making it one of the world’s largest and most influential economies. The UK has fertile soils and a long industrial background, but it’s the booming services sector and ‘knowledge’ economy that now dominates the country’s wealth creation. The service sector earns 75% of the UK’s GDP (compared with just 1.2% from agriculture and 23.8% from industry/ manufacturing). However, despite its current size and influence, the British economy is facing an uncertain future. The UK has an ageing population, with increasing numbers of people moving from work into retirement. In 2010, the average life expectancy in the UK for anyone reaching their sixtieth birthday was another 23 years! The country has the serious problem of working out how to support millions of people who might be retired for 20 years or more. This problem is not helped by the fact that the UK’s birth rate is falling, and has been for decades. Where are the workers going to come from to support the pensioners of the future? What will happen to the UK’s dependency ratio? Food for thought! The UK’s population structure For almost every British family, there has been a consistent fall in family size since 1900. The stereotypical suburban ‘2.4 children’ per family was coined in the 1950s – having been about 5 in 1900. Now it’s about 1.7. At the same time, people are living longer. The effect of this is to
However, because many women now start their families later in life, they have to face the consequence that they will be less fertile at that point. The chances of conception decrease for a woman in her thirties, making it more likely that family size for older mothers will be smaller – especially if they want to return to work for periods between having children. As well as many British women starting their families later in life, increasing numbers are also deciding never to have children at all. In 2009, research by the London School of Economics showed that 10% of women aged 45 were intentionally child-free, and that 25% of younger women were also child-free at that point. The researchers suggested that both figures will increase in the future. One conclusion is inescapable. At present, the UK’s population will not replace itself by natural change. Many politicians quietly believe – because the issue is sensitive with public opinion – that immigration must be encouraged to maintain a strong workforce and economy The ageing trend ‘Ageing’ is also known as the ‘greying’ of the population. By 2014, for the first time, there will be more people aged over 65 in the UK than under 16. Not only are more people surviving into retirement, but many are living to a ripe old age. There are already 1.2 million people aged over 85 in the UK. Is immigration the answer? Migration into the UK – together with most HICs – is at an all-time high. But, until 2000, more emigrants left the UK (for places like Australia and Spain), than immigrants arrived. Immigration into the UK has come from two main groups: ● Since the late 1940s, there has been a steady flow of immigrants from Commonwealth countries such as India, Pakistan and Caribbean nations like Jamaica, together with smaller flows from Africa. ● In 2004, the EU was enlarged with ten extra countries. Because of EU rules about the free movement of labour in member states, there was a surge in immigration to the UK from Central and Eastern Europe. Polish migrants constitute the UK’s largest single migration ever. Alongside social changes in the UK’s population – such as falling birth, death and fertility rates – immigration has had a real impact, especially in the last 30 years: ● Immigration from India, Pakistan and the Caribbean during the 1950s/60s, coincided with a baby boom in the UK. As a result, natural increase was responsible for 98% of the UK’s population growth – and net immigration just 2%. ● But, since the 1980s, net immigration has contributed more and more of the UK’s population growth. As the fertility rate has fallen, so has natural increase. ● From 2001 to 2008, net immigration added 180 000 people to the population each year, compared with 90 000 from natural increase – a ratio of 2:1. Recent immigrants from the EU tend to be young and well qualified. In 2008, about 70% of EU immigrants who registered for work in the UK were aged 18-35, and most were graduates. Family related migration is also becoming more common. Those arriving with dependent children increased from 4% in 2004 to 15% by 2009. Birth statistics show that the number of children born in the UK to mothers from other EU countries has increased substantially since 2004. Immigrant populations tend to have a younger age structure than the white British population (Figure 5.27). For example, large numbers of Black Africans migrated to the UK in the mid-1980s as children. Now, many of them have their own young families, which explains the large percentages of under 16s
Benefits Problems Many ‘retired’ people still do part- or full-time work – to keep themselves active and to supplement their pensions. Over 25% of the employees at DIY chain B&Q are aged over 55. Retired people are useful for companies, because they can work flexible hours and do not carry costs such as National Insurance. They also have a lot of skills, experience and knowledge, which can be passed on. Many businesses have developed to service the ‘grey pound’ (wealthy retired people, such as those with generous private pensions). For example, DIY outlets, gardening centres, and specialist holiday companies. The growing private health sector also regards the ageing population as an opportunity. Firms providing private healthcare insurance, e.g. BUPA, or companies such as Boots (who offer healthcare services), regard the elderly as good business. The investment of pension funds by fund managers provides a valuable source of money for companies and organizations in both the private and public sectors. For example, many British pension funds invest in big companies like BP. Many elderly people only have the basic State pension to live off. If the price of food or fuel rises, it’s harder for those on fixed pensions to compensate for it. Poverty amongst the elderly is a major challenge for the government – and for non-governmental organizations, like Age UK, which campaign on their behalf. The World Health Organization (WHO) warns that ageing populations worldwide will lead to increasing heart disease, cancers, and diabetes. Treating these is expensive and provides a real challenge for the NHS – and the voluntary sector (e.g. Macmillan Cancer), which relies on donations of money and time from volunteers. An ageing population also creates a need for new housing, e.g. smaller properties with no stairs, wider doorways and lower kitchen units for those with limited mobility. And sheltered accommodation for those who need carers on site. A growing pensions crisis is emerging. State pensions in the UK are paid for by National Insurance (NI) contributions from those in work. As life expectancy increases, more people are claiming pensions for longer. The ratio of people in work compared to over 65s is falling. In 2000, there were 3.7 people in work for every person aged over 65. By 2040, this ratio will have fallen to 2.1. The government will be receiving less tax revenue from the smaller number of workers, just as demand for pensions and healthcare is rising.
Compare and contrast the age/sex pyramids shown in Figures 3 and 4. What factors help to explain their shapes? How are the economies of the two places likely to differ as a result of their differing population structures?
What are the issues that are already apparent in those countries with the most ‘aged’ populations? These are mainly in Europe and perhaps surprisingly they include most of the Catholic countries of southern Europe. Recent research in those countries has revealed two related causal factors: 1) the wish of increasing numbers of women in those countries to have careers, and 2) a lack of nursery facilities, crèches, etc. to look after children while parents at work. The tension between these two factors is such as to persuade many couples to opt out of having children altogether. So what are your perception of an ageing population?
• more old people (more ‘Saga louts’) • rising ill-health • increased expenditure on services • higher levels of dependency • hindered economic growth.
What about positive perceptions….? WOOPies JOLLies SKI holidays Well Off Elderly Persons Jet-setting Oldies with Loads of Loot Spending the Kids Inheritance on holidays
Special needs of the elderly These needs are not just medical (important though they are). They range from large-print books to meals on wheels, from stair-lifts to granny mobiles. The last two perhaps remind us the one of the most acute needs is to reduce the impairing effects of restricted mobility both within and outside the home. Foremost here then are services that help the elderly to retain their independence and quality of life. The growing stocks of granny flats, wardened and sheltered accommodation, care homes are a sign of things moving in the right direction, but not fast enough. Developers and local planning authorities have been slow to anticipate the demand simply because they have not bothered to look at forecasts of demographic change.
Coordinating care Meeting the diversity of needs suggested above means the involvement of public and private agencies of all kinds. All too often the right hand does not know what the left is doing. There is great scope for improving cooperation and coordination. Maybe it will not be too long before governments realise the benefits of bringing together the many agencies under a Ministry for the Elderly.
Cost and access to services When the costs of an ageing population are calculated, it is usually the cost of pension systems that dominate the debate. But there is another cost of almost the same proportion to face – that of the healthcare and long-term care for the elderly that we have just implied. Cost obviously leads to access. The aim should be equality of access for all to all those things that contribute to the quality of life of the elderly. Is this an unattainable ideal? Sadly, differences in income and in levels of development lead to the creation of insurmountable hurdles.
Who cares? Clearly, this links with health. Much also hinges on the prevailing family type and housing situation. The extended family still prevalent in LEDCs is likely to have a good measure of in-built care. The nuclear family has shifted the onus to professional providers in the form of sheltered accommodation, care homes, etc. This in turn creates a serious financial issue for many families. There is a large amount of global evidence to show that the elderly are increasingly the victims of neglect, violence and abuse. We are only too well aware of the first two in the UK. In LEDCs, abuse relates more to widowhood rites harmful to women, and traditional practices involving older persons.
A feminised cohort Given the biological fact of greater female longevity, there is the prospect of an expanding elderly cohort increasingly dominated by women! Is this a heaven or hell prospect?
Migration moves Three types of migration are becoming increasingly conspicuous in MEDCs - 1) retirement, downsizing moves; 2) bereavement moves occasioned by the death of a partner, and 3) moves into specialist care accommodation. There is the prospect that the convergence of these migration moves could easily result in the creation of ‘grey ghettos’, particularly within towns and cities. There is also a wholly different type of migration becoming evident. As work in the care sector becomes less attractive to ‘native’ workers, both in terms of image and pay, so increasing numbers of migrant workers are being drawn in from overseas to fill key jobs - from cooks and cleaners to nurses and doctors.
Retirement & pensions The fact that people in MEDCs are, on average, now experiencing between 10 and 20 years of retirement is creating enormous pressures on pension schemes, both state and private. As the proportion of the population creating wealth and paying taxes goes down, soon a point is reached when income from taxes cannot keep pace with expenditure on welfare. At present, an average of 25% of GDP goes on welfare spending in EU countries. Just under half of this expenditure goes on pensions. In the UK, where state pensions are already reduced to a pitiful pittance, two moves are afoot. The first is to raise the age of retirement. For women, it is already going up to 65; it may soon be 67 for everyone. Raising pension ages reduces the pensioner population at a stroke. The second move is to encourage everyone to invest in their own private pension schemes. Recent scandals associated with the selling of private pensions have created a great deal of distrust.
Contracting labour supply A contracting labour supply, not just in the care sector, is something that none of today’s employers has ever seen. Obviously, population ageing is the prime cause, but there are other factors also contributing to the skills and labour shortages. These include early retirement and employers’ reluctance to recruit what they see as ‘grey’ labour (often anyone over 50, and often the fall-out of redundancy). Ignoring the skills and experience of the over 50s is clearly a case of employers shooting themselves in the foot.
The grey pound An ageing population means a broad shift in the pattern of consumer demand. Again, elderly people have need of a particular range of goods (possibly described as ‘the A to Z - from armchair recliners to Zimmer frames). Retailers need to be increasingly alive to the grey market as the young free-spenders dwindle in number.
The grey vote With a sizeable percentage of the electorate of pensionable age (it might be approaching 50% in the UK), the grey vote has, in theory, a powerful political punch. In this country, politicians and pensioners are only just beginning to wake up to this potential power. It was perhaps surprising that in the recent General Election campaign in the UK there was little focus on the elderly other than indirectly in the contexts of the NHS and spending on social services. As to the future, it seems clear that MPs and political parties need to beware of one reality – ignore the grey vote at your peril!
The grey lobby Also adding to this political clout is the lobbying potential of the elderly. They have the time, and most often the expertise, to press their particular interests. They can be much more single minded. If mobilised, the elderly could readily become an articulate and influential pressure group. Indeed, it could be that an active pursuit of elderly issues could lead eventually to the formation of a Grey Party!
The grey MP Given that there is no upper age limit on serving as a member of parliament, the elderly cohort might find itself better represented than in the past. Elderly MPS are more likely to be disposed to fight their corner on issues close to home and to the heart.
Some concluding points At present, the issues of an ageing population are most evident in MEDCs where, because of greater life expectancy, the elderly are a much more conspicuous component of the population. It is too early to say whether or not the issues will be the same in LEDCs as their populations become more ‘grey’. At present, short life expectancy and the prevalence of the extended family mean that retirement, pensions and care are not major issues. But should there be a significant change in either of these two factors, then the whole situation could change quite dramatically.