Dependency Ratio
Dependency Ratio. The proportion of persons above 65 years and below 15 years of age are considered to be dependent on the economically productive age group. The ratio of combined age group 0-14 years plus 65 years and above to the 15-65 years age group is referred as dependency ratio.


Dependency Ratio
E N D
Presentation Transcript
Dependency Ratio The proportion of persons above 65 years and below 15 years of age are considered to be dependent on the economically productive age group. The ratio of combined age group 0-14 years plus 65 years and above to the 15-65 years age group is referred as dependency ratio.
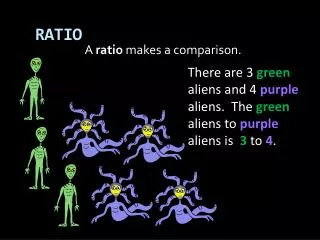
Sex Ratio It is the number of females per 1000 males It is affected by Mortality conditions among male and females Sex selective migration Sex ratio at birth Sex ratio= no. of males/no. of femalesX100
POPULATION PYRAMID It is a pictorial presentation of age sex composition of a population. Male to female ratio in diff. age groups Population is old or young Dependency ratio Rate at which population is increasing Recent changes in fertility or mortality.
Dependency Ratio Pakistan = > 80 % Japan = 43 %
Growth rates 95% growth is in developing countries One third of world population is , 15 years of age Population will be 8 billion in 2025 Population will be 10 billion in 2050 Population will be 20.7 billion in 2100.
Growth rates 176 per minute 10564 per hour 253,542 per day 92,543,000 per year
FECUNDITY • Fecundity indicates the physiological ability among woman to conceive or to bear children. • 42 children in 35 years • 69 children • Highest average no. of births for any population is 10 / woman among a small Christian group in USA and Canada.
FERTILITY It refers to the actual bearing of children by a woman It is the actual reproductive performance of the woman or a couple.
FERTILITY • Universality of marriage • Lower age at marriage/ duration of married life • Low level of literacy/ educational status • Poor level of living / Economic status • Limited use of contraceptives / spacing of children • Traditional ways of life / religion • Nutrition • Others
FERTILITY • Others • Psychological • Natural urge of being parent & to have children • Social • Educational status, Age at marriage, early marriage, family set up, family pressure. • Economic • Security to parents in older age, potential earners, • Demographic • Too many children, • high mortality results in high fertility • Biological effects • Curtailment of early breast feeding
General fertility rate (GFR) • It is the no. of live births per 1000 women in the reproductive age group in a given year. • It is a better measure of fertility
Age Specific Fertility RateASFR • It is the no. of live births in a year to 1000 women in any specified age group. • ASFR indicates the fertility pattern • A sensitive indicator of family planning achievement.
TOTAL FERTILITY RATE (TFR) • It represents the average number of children a woman would have if she were to pass through her reproductive years bearing children at the same rates as the woman now in each age group.
GROSS REPRODUCTION RATE • It is the average number of girls that would be born to a woman if she experiences the current fertility pattern through out her reproductive span.
NET REPRODUCTION RATE • It is the number of daughters a newborn girl will bear during her life time assuming fixed age specific fertility and mortality rates. • It is a demographic indicator • NRR 1 indicates the attaining of app. the 2 child norm.
MORTALITY It refers to the experience of a population in terms of deaths. Frequency of age, sex and cause of death in a society would reveal the underlying health problems and health services shortcomings and would identify specific interventions.
URBANIZATION It occurs due to migration of rural population into urban centers / areas resulting in increase in urban population and growth of cities.