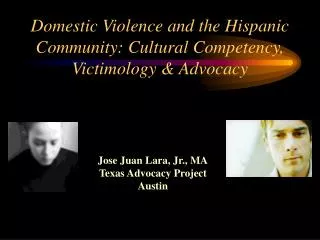
The Hispanic/Latino Community: Partnering to Combat Domestic Violence
The Hispanic/Latino Community: Partnering to Combat Domestic Violence. Barbara Seitz de Martinez -- Indiana Prevention Resource Center Gloria Belange King -- Hispanic Health Project, Wishard Hospital Kimber Nicoletti -- CARe Initiative Denise Rodriguez -- Center of Hope, Wishard Hospital.

The Hispanic/Latino Community: Partnering to Combat Domestic Violence
E N D
Presentation Transcript
The Hispanic/Latino Community: Partnering to Combat Domestic Violence Barbara Seitz de Martinez -- Indiana Prevention Resource Center Gloria Belange King -- Hispanic Health Project, Wishard Hospital Kimber Nicoletti -- CARe Initiative Denise Rodriguez -- Center of Hope, Wishard Hospital 2005 Many Voices One Vision Conference Convention Center Indianapolis, Indiana August 2, 2005 The Indiana Prevention Resource Center at Indiana University is funded in part by a contract with the Indiana Family and Social Services Administration, Division of Mental Health and Addiction.
Organization of Presentation -- The Community: Background and Statistics -- Risk Factors: Vulnerabilities and Cultural Characteristics -- Solutions: Introducing the Latino Coalition Against Domestic Violence and Sexual Assault Thanks to the Center for Substance Abuse’s Hispanic Initiative for the black and white photos used throughout this presentation.
Part I: The Community Indiana’sHispanic/LatinoPopulation Background & Statistical
Latino vs. Non-L Population Growth The United States Hispanic Leadership Institute, The Almanac of Latino Politics 2002 & 2004 (Chicago, 2002): 1. Source 2000 Census. U.S. Census SF3 and AGS 2004 est. (2005)
Indiana’s Hispanics/Latinos, 2000 Total Population: 2000: 214,536 RED=Most, Greens, Dark (More) Light (Least)
Indiana’s Hispanics/Latinos, 2003 Top 10 Counties, Hispanic/Latino Population (No.) Percent of Total Population: 4.1 %
Indiana’s Hispanics/Latinos, 2004 Total Population: 2002: 236,733 2004: 255,755 AGS 2004 (2005) Count
Indiana’s Hispanics/Latinos, 2009 Total Population: 2002: 236,733 2004: 255,755 2009: 307,290 Percent
Hispanic/Latino Pop Growth 2004-9 Total Population: 2002: 236,733 2004: 255,755 2009: 307,290 Indiana Growth 20%
Indiana’s Hispanics/Latinos U.S. Census Bureau; AGS, Core Demographics, 2000 (2001); 2004 est. (2005)
Indiana’s Hispanics/Latinos, 2003 Top 10 Counties, Hispanic/Latino Population (No.) Total Population: 253,697
Indiana’s Hispanics/Latinos, 2003 Top 10 Counties, Hispanic/Latino Population (%) % of Total Pop: 4.1%
IN’s Cities w/ Most Latinos, 2003 IN Places 6.4% AGS, Core Demographics, 2003 est. (2004)
IN’s Cities w/ Most Latinos, 2003 IN Places 6.4% AGS, Core Demographics, 2003 est. (2004)
Indianapolis Hispanic/Latino Population Growth 1990-2003 • 6th highest city (299% growth to 2000) • from 1% to 4.1% of population The United States Hispanic Leadership Institute, The Almanac of Latino Politics 2002 & 2004 (Chicago, 2002): 7.
Recent Immigration • Est. 14.5 million foreign born Latinos in 2000 • Up from 1.8 m in 1970 • Average immigration of 500,000 persons each year • Over half (51%) of U.S. foreign born population was born in Latin America in 2000 • Up from 9% in 1960 The United States Hispanic Leadership Institute, The Almanac of Latino Politics 2002 & 2004 (Chicago, 2002): 13.
Hispanic/Latino Diversity • Racial • Cultural • Religious • Linguistic • Socioeconomic
Chican@s Puerto Ricanos Borriqua Hispan@s Mexicans Mexican-Americans Cuban@s South Americans Hispanoparlantes Hispanic Central Americans Hispanic/Latinos: Why are there so many different terms?
A Peek at Latin@ Culture • Latin@s come from 20 plus countries. • According to 2002 Census, One in Eight people in the U.S is of Hispanic origin. • Spanish is the second most common language in the United States. • 53% Latino Youth graduate high school. • 77% of Latinos in the U.S. are Catholic.
A Peek into Latin@ Culture • Personalismo • Familismo • Collectivismo • Traditional Gender Roles
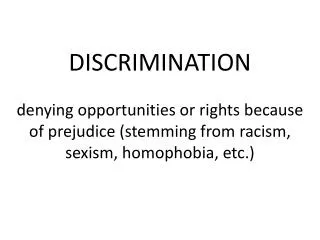
Barriers The National Violence Against Women Survey found that Latin@ women were less likely to report rape victimization than non-Latin@ women.
Cultural Values Taboos around sexuality Gender role issues Importance of family/community
Language Barriers Women in general and even bilingual youth may still have preference for first language when dealing with sensitive topics.
Dialect • Acculturation • Attitude • Awareness
Distrust of the system/police Lack of Service/culturally appropriate services Lack of sensitivity training for police
Hispanic/Latino Characteristics IN Places 6.4% AGS Indiana, 2003: Core Demographic
Risk Factors (DV and SA) • Mobility (Recent Immigration and Migration) • Cultural Values and Acculturation • Distrust of the system/police • Lack of Support System • Poverty • High Risk Jobs • No Health Insurance • Depression • Language Barrier - Awareness • Educational Background - Awareness
Risk Factor: Mobility • Statistics • Recent Immigration • Marion Co: 50% here 0-2 years (2000) • Marion Co: 88% foreign born • Migration (migrant farmers, etc.) • Effects • Stress, lack of support group,
Risk Factor: Isolation • Stats • Recent Immigration • Mobility in general • Effects Stress Lack of Support System Difficulty knowing about and accessing resources
Risk Factor: Poverty • Statistics • 56% in unskilled jobs (working poor) • Per capita income less than for Non-H W or Afr-Am • Rate for H/Latinos 3x higher than for non-Hisp (e.g., 8% for Whites; 22.8% for Hispanics) • Effects • Stress • Crowding (> 1/3 in “shared housing”) • 90% rent
Risk Factor: High Risk Jobs • Statistics • Deaths on the job about 20% higher than for Non-Hispanics (BLS) • Effects • Stress • Health costs • Lack of Income
Risk Factor: No Health Insurance • Statistics • 34% of total Hispanic/Latino population • 29% of all Hispanic/Latino children • 30% of all poor Hispanic/Latino children • Effects • Reluctance to seek medical assistance • Poor health status, stress
In U.S., 16% (~43 million) lack health insurance Insurance Barriers to Health Source: Census 2000.
Health Disparities • AIDS (Men>3x, Women>5x more likely) • Diabetes (IL, 45-54 yrs, 15.9% vs 4.6%) • Self-rated poor health (28.9% vs 14%)
Risk Factor: Depression • Statistics • Depression from isolation, poverty, stress • Effects • General negative health impact • Irritability, substance abuse
Risk Factor: Language Barrier • Statistics • Marion Co: 88% foreign born • Marion Co: 50% 0-2 years here • Marion Co: 1st generation residents • Effects • Reluctance to see health care • Barriers to quality health care, lack of translators
Risk Factor: Low Literacy • Statistics • Marion Co: 60% have less than HS education • Effects • Difficulty accessing resources • Economic difficulty
Educational Barriers to Health Care Census 2000.
Insurance Language Status - Fear Mobility Economic Policy - Fear Health Care System Acculturation Education Barriers to Health Care
Shame Fear and Anxiety Traumatic Reactions Alliance w/ Batterer Parentification Aggression Rage Depression Runaways Delinquency Dating Violence Impacts of DV on Children O’Keefe, Maura and Shirley Lebovics, “Adolescents from Maritally Violent Homes,” Prevention Researcher 12/1 (Feb. 2005):3-7.
Need Help? Source: Domestic Violence Network of Greater Indianapolis, www.dvngi.org
Need Help? Source: National Coalition Against Domestic Violence, www.ncadv.org
Need Help? Source: Domestic Violence Network of Greater Indianapolis, www.dvngi.org
Need Help? Source: Domestic Violence Network of Greater Indianapolis, www.dvngi.org
Statistics : DV • Nationally: 25% of women sexually assaulted • Marion County: • 100,000+ at some pt in life • 3,000 sought protective order • 5,500 reports of domestic violence to LE • Nationally: 3+ killed daily • Indiana: 64 deaths by DV in 12 mos. Source: Domestic Violence Network of Greater Indianapolis, www.dvngi.org
Statistics : Domestic Homicide • Nationally: 3+ killed daily • Indiana: 64 deaths by DV in 12 mos. Source: Domestic Violence Network of Greater Indianapolis, www.dvngi.org
Statistics : Violence and Youth • Nationally: 1 in 5 females in HS • Marion Co: perhaps > 10,000, 15-24, in 1 yr. Source: Domestic Violence Network of Greater Indianapolis, www.dvngi.org