Download
1 / 15
150 likes | 185 Views
Learn about polynomial functions, including identifying them, graphing with transformations, finding zeros and their multiplicities, and analyzing graphs. Understand degree, real zeros, turning points, and power function resemblance.

E N D
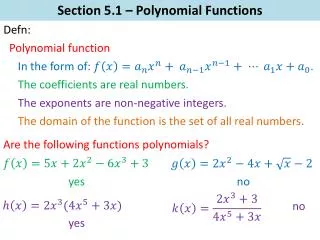
Sullivan Algebra and Trigonometry: Section 5.1Polynomial Functions • Objectives • Identify Polynomials and Their Degree • Graph Polynomial Functions Using Transformations • Identify the Zeros of a Polynomial and Their Multiplicity • Analyze the Graph of a Polynomial Function
A polynomial function is a function of the form where an , an-1 ,…, a1 , a0are real numbers and n is a nonnegative integer. The domain consists of all real numbers. The degree of the polynomial is the largest power of x that appears.
Example: Determine which of the following are polynomials. For those that are, state the degree.
(1,1) (0,0) (0,0) (1, -2) Graph the following function using transformations.
(1, 4) (1,0) (2, 2) (2,-2)
2 f ( x ) = ( x + 1 )( x - 4 ) Consider the polynomial: 2 f ( x ) = ( x + 1 )( x - 4 ) = 0 Solve the equation f (x) = 0 x + 1 = 0 OR x - 4 = 0 x = - 1 OR x = 4 If f is a polynomial function and r is a real number for which f (r) = 0, then r is called a (real) zero of f, or root of f. If r is a (real) zero of f, then a.) (r,0) is an x-intercept of the graph of f. b.) (x - r) is a factor of f.
If is a factor of a polynomial f and is not a factor of f, then r is called a zero of multiplicity m of f. Example: Find all real zeros of the following function and their multiplicity. x = 3 is a zero with multiplicity 2. x = - 7 is a zero with multiplicity 1. x = 1/2 is a zero with multiplicity 5.
If r is a Zero of Odd Multiplicity Sign of f (x) changes from one side to the other side of r. Graph crosses x-axis at r. If r is a Zero of Even Multiplicity Sign of f (x) does not change from one side to the other side of r. Graph touches x-axis at r.
Theorem: For large values of x, either positive or negative, the graph of the polynomial resembles the graph of the power function Theorem: If f is a polynomial function of degree n, then f has at most n - 1 turning points.
2 f ( x ) = x + 1 x - 5 x + 4 For the polynomial ( ) ( ) ( ) (a) Find the x- and y-intercepts of the graph of f. The x intercepts (zeros) are (-1, 0), (5,0), and (-4,0) To find the y - intercept, evaluate f(0) So, the y-intercept is (0,-20)
2 f ( x ) = x + 1 x - 5 x + 4 For the polynomial ( ) ( ) ( ) b.) Determine whether the graph crosses or touches the x-axis at each x-intercept. x = -4 is a zero of multiplicity 1 (crosses the x-axis) x = -1 is a zero of multiplicity 2 (touches the x-axis) x = 5 is a zero of multiplicity 1 (crosses the x-axis) c.) Find the power function that the graph of f resembles for large values of x.
2 f ( x ) = x + 1 x - 5 x + 4 For the polynomial ( ) ( ) ( ) On the interval d.) Determine the maximum number of turning points on the graph of f. At most 3 turning points. e.) Use the x-intercepts and test numbers to find the intervals on which the graph of f is above the x-axis and the intervals on which the graph is below the x-axis. Test number: x = -5 f (-5) = 160 Graph of f: Above x-axis Point on graph: (-5, 160)
2 f ( x ) = x + 1 x - 5 x + 4 For the polynomial ( ) ( ) ( ) On the interval On the interval Test number: x = -2 f (-2) = -14 Graph of f: Below x-axis Point on graph: (-2, -14) Test number: x = 0 f (0) = -20 Graph of f: Below x-axis Point on graph: (0, -20)
2 f ( x ) = x + 1 x - 5 x + 4 For the polynomial ( ) ( ) ( ) On the interval Test number: x = 6 f (6) = 490 Graph of f: Above x-axis Point on graph: (6, 490) f.) Put all the information together, and connect the points with a smooth, continuous curve to obtain the graph of f.
(6, 490) (-1, 0) (-5, 160) (0, -20) (5, 0) (-4, 0) (-2, -14)