Download
1 / 13
130 likes | 157 Views
This section explains how to find the average rate of change of a function, determine if a function is increasing, decreasing, or constant using a graph, locate maxima and minima, and identify even and odd functions from a graph or equation.

E N D
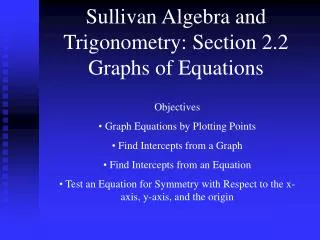
Sullivan Algebra and Trigonometry: Section 3.2 • Objectives • Find the Average Rate of Change of Function • Use a Graph to Determine Where a Function Is Increasing, Is Decreasing, or Is Constant • Use a Graph to Locate Maxima and Minima • Determine Even, Odd Functions from a Graph • Identify Even, Odd Functions from the Equation
If c is in the domain of a function y = f(x), the average rate of change of fbetween c and x is defined as This expression is also called the difference quotient of f at c.
The average rate of change of a function can be thought of as the average “slope” of the function, the change is y (rise) over the change in x (run). y = f(x) Secant Line (x, f(x)) f(x) - f(c) (c, f(c)) x - c
Example: The function gives the height (in feet) of a ball thrown straight up as a function of time, t (in seconds). a. Find the average rate of change of the height of the ball between 1 and t seconds.
b. Using the result found in part a, find the average rate of change of the height of the ball between 1 and 2 seconds. Average Rate of Change between 1 second and t seconds is: -4(4t - 21) If t = 2, the average rate of change between 1 second and 2 seconds is: -4(4(2) - 21) = 52 ft/second.
A function f is increasing on an open interval I if, for any choice of x1 and x2 in I, with x1 < x2, we have f(x1) < f(x2). A function f is decreasing on an open interval I if, for any choice of x1 and x2 in I, with x1 < x2, we have f(x1) > f(x2). A function f is constant on an open interval I if, for any choice of x in I, the values of f(x) are equal.
y (2, 3) 4 (4, 0) 0 (1, 0) x (0, -3) (10, -3) (7, -3) -4 Determine where the following graph is increasing, decreasing and constant.
A function f has a local maximum at c if there is an interval I containing c so that, for all x in I, f(x) < f(c). We call f(c) a local maximum of f. A function f has a local minimum at c if there is an interval I containing c so that, for all x in I, f(x) > f(c). We call f(c) a local minimum of f.
y (2, 3) 4 (4, 0) 0 (1, 0) x (0, -3) (10, -3) (7, -3) -4 Referring to the previous example, find all local maximums and minimums of the function:
A function f is even if for every number x in its domain the number -x is also in the domain and f(x) = f(-x). A function is even if and only if its graph is symmetric with respect to the y-axis. A function f is odd if for every number x in its domain the number -x is also in the domain and -f(x) = f(-x). A function is odd if and only if its graph is symmetric with respect to the origin.
Determine whether each of the following functions is even, odd, or neither. Then determine whether the graph is symmetric with respect to the y-axis or with respect to the origin. a.) Even function, graph symmetric with respect to the y-axis.
b.) Not an even function. Odd function, and the graph is symmetric with respect to the origin.