Download
1 / 14
140 likes | 172 Views
Learn to graph, identify vertex and axis of symmetry, and apply transformations to quadratic functions. Understand how to find the best fit quadratic function using a graphing utility. Discover real-world applications through examples.

E N D
Sullivan Algebra and Trigonometry: Section 4.3Quadratic Functions/Models • Objectives • Graph a Quadratic Function Using Transformations • Identify the Vertex and Axis of Symmetry of a Quadratic Function • Graph a Quadratic Function Using the Vertex, Axis of Symmetry, and Intercepts • Use a Graphing Utility to Find the Quadratic Function of Best Fit
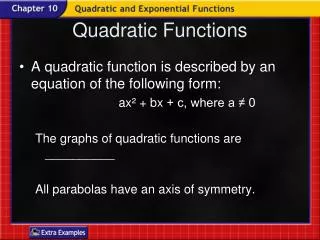
A quadratic function is a function of the form: where a, b, and c are real numbers and a 0. The domain of a quadratic function consists of all real numbers. The graph of a quadratic function is called a parabola.
Graphs of a quadratic function f(x) = ax2 + bx + c, a 0 Vertex is highest point Axis of symmetry Axis of symmetry Vertex is lowest point a< 0 a> 0 Opens up Opens down
2 f ( x ) = - 2 x + 8 x - 1 Graph the function Find the vertex and axis of symmetry. First, rewrite the function by completing the square
(2,4) (0,0) (0,0) (2, -8) Now, graph the function using the transformations discussed in Chapter 3.
(2, 7) (2, 0) (4, -1) (4, -8) Vertex : (2,7)
Properties of the Quadratic Function Parabola opens up if a > 0. Parabola opens down if a < 0.
2 f ( x ) = 2 x + 12 x + 5 - b x = = - 3 Axis of symmetry: Vertex: (-3, -13) 2 a Given the function , determine whether the graph opens upward or downward. Find the vertex, axis of symmetry, the x-intercepts, and the y-intercept. x-coord. of vertex: y-coord. of vertex:
2 f ( x ) = 2 x + 12 x + 5 2 f ( x ) = 2 x + 12 x + 5 y-intercepts: f(0) = 5; so the y-intercept is (0,5) x-intercepts: Solve the equation = 0 The x-intercepts are approximately (-5.6,0) and (-.45,0) Summary: Parabola opens up Vertex (-3, -13) y-intercept: (0,5) x-intercepts: (-0.45, 0) and (-5.55,0)
(0, 5) (-5.55, 0) (-0.45, 0) Vertex: (-3, -13) Now, graph the function using the information found in the previous steps.
If a mathematical model of a real world situation leads to a quadratic function, the properties of the function can be applied to the model. Example: The John Deere Company has found that the revenue from sales of heavy duty tractors is a function of the unit price p that it charges. If the revenue R is what unit price p should be charged to maximize revenue? What is the maximum revenue?
Note that the revenue function is a quadratic function that opens downward, since a < 0. So, the maximum revenue will be achieved at the vertex of the function. x-coord. of vertex: y-coord. of vertex: So, the maximum revenue occurs when they charge $1900. The maximum revenue is $1,805,000.
Suppose you throw a ball straight up and record the height of the ball in 0.5 second intervals and obtain the following data:
Use a graphing utility to complete the following: a.) Draw a scatter diagram of the data. b.) Find the quadratic function of best fit. c.) Draw the quadratic function of best fit on the scatter diagram.