Download
1 / 18
200 likes | 255 Views
Explore polynomial functions like monomials, degrees, and turning points. Learn to classify, write in standard form, and analyze end behavior. Discover how to determine degrees based on end behaviors and turning points while writing equations for specific graph characteristics.

E N D
Section 5.1 – Polynomial Functions Students will be able to: Graph polynomial functions, identifying zeros when suitable factorizations are available and showing end behavior. Lesson Vocabulary: Monomial Degree of a Monomial Polynomial Degree of a Polynomial Polynomial Function Standard Form Turning Point End Behavior
Section 5.1 – Polynomial Functions Essential Understanding: A polynomial function has distinguishing “behaviors”. You can look at its algebraic form and know something about it’s graph. You can look at its graph and know something about its algebraic form.
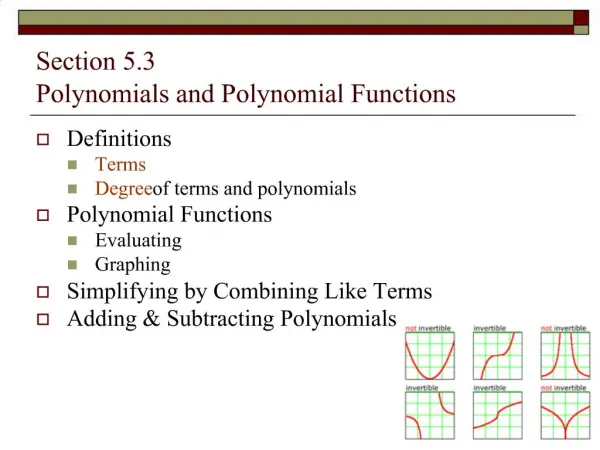
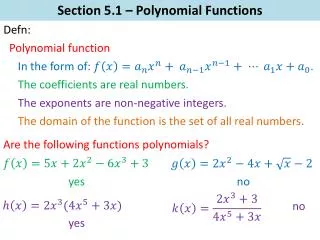
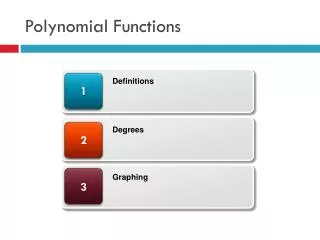
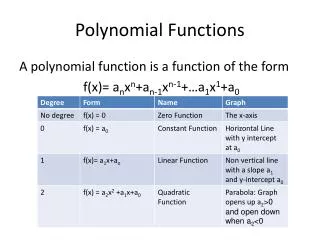
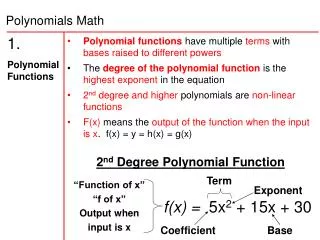
Section 5.1 – Polynomial Functions A monomial is a real number, a variable, or a product of a real number and one or more variables with whole number exponents. The degree of a monomial in one variable is the exponent of the variable. A polynomial is a monomial or a sum of monomials The degree of a polynomial in one variable is the greatest degree among its monomial terms.
Section 5.1 – Polynomial Functions A polynomial with the variable x defines a polynomial function of x. The degree of the polynomial function is the same as the degree of the polynomial.
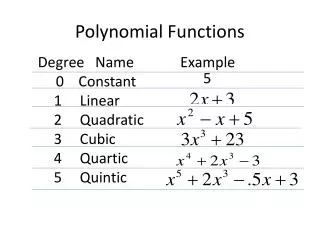
Section 5.1 – Polynomial Functions You can classify a polynomial by its degree or by its number of terms. Polynomials of degrees zero through five have specific names, as shown in this table.
Section 5.1 – Polynomial Functions Problem 1: Write each polynomial in standard form. What is the classification of each by degree? By number of terms?
Section 5.1 – Polynomial Functions Problem 1: Write each polynomial in standard form. What is the classification of each by degree? By number of terms?
Section 5.1 – Polynomial Functions The degree of a polynomial function affects the shape of its graph and determines the maximum number of turning points, or places where the graph changes direction. It also affects the end behavior, or the directions of the graph to the far left and to the far right.
Section 5.1 – Polynomial Functions The table on the next slide shows you examples of polynomial functions and the four types of end behavior. The table also shows intervals where the functions are increasing and decreasing. A function is increasing when the y-values increase as x-values increase. A function is decreasing when the y-values decrease as the x-values increase.
Section 5.1 – Polynomial Functions In general, the graph of a polynomial function of degree n (n > 1) has at most n – 1 turning points. The graph of a polynomial function of odd degree has an even number of turning points. The graph of a polynomial function of even degree has an odd number of turning points.
Section 5.1 – Polynomial Functions Problem 2: Consider the leading term of each polynomial function. What is the end behavior of the graph? Check your answer with a graphing calculator. y = 4x3 – 3x y = -2x4 + 8x3 – 8x2 + 2
Section 5.1 – Polynomial Functions Problem 3: What is the graph of each function? Describe the graph, including end behavior, turning points, and increasing/decreasing intervals. y = ½x3 y = 3x - x3
Section 5.1 – Polynomial Functions Problem 3b: What is the graph of each function? Describe the graph, including end behavior, turning points, and increasing/decreasing intervals. y = -x3 + 2x2 – x – 2 y = x3 - 1
Section 5.1 – Polynomial Functions Suppose you are given a set of polynomial function outputs. You know that their inputs are an ordered set of x-values in which consecutive x-values differ by a constant. By analyzing the differences of consecutive y-values, it is possible to determine the least-degree polynomial function that could generate the data. If the FIRST DIFFERENCES are constant, the function is linear. If the SECOND DIFFERENCES are constant, the function is quadratic, If the THIRD DIFFERENCES are constant, the function is cubic, and so on!!
Section 5.1 – Polynomial Functions Problem 4: What is the degree of the polynomial function that generates the data shown at the left?
Section 5.1 – Polynomial Functions Problem 4b: What is the degree of the polynomial function that generates the data shown at the left?
Section 5.1 – Polynomial Functions Problem 5: Write an equation for a polynomial function that has three turning points and end behavior up and up.