Download
1 / 5
50 likes | 128 Views
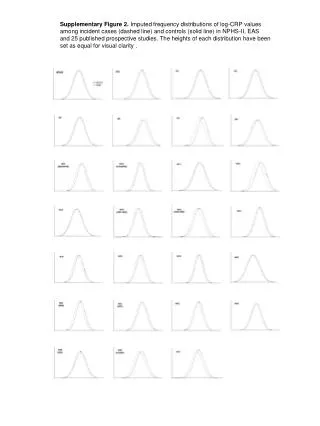
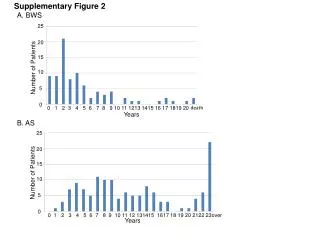
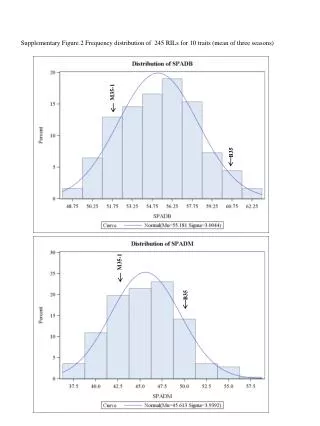
Supplementary Figure 2 showing the frequency distribution of 245 recombinant inbred lines (RILs) for 10 traits across three seasons, including M35-1, B35, and their combinations.

E N D
Supplementary Figure.2 Frequency distribution of 245 RILs for 10 traits (mean of three seasons) M35-1 B35 M35-1 B35
B35 M35-1 M35-1 B35
B35 M35-1 B35 M35-1
M35-1 B35 M35-1 B35
M35-1 B35 B35 M35-1