Download
1 / 5
50 likes | 159 Views
p<0.0001. p=0.0023. p<0.0001. p<0.0001. Supplemental figure 1 ROS production in MM cell line (KMM1) treated with bortezomib and DCA. ROS production was marginally increased by DCA in combination with bortezomib. (N=27). (N=27). (N=27). (N=27). p=0.84 (log rank). p=0.24 (log rank).

E N D
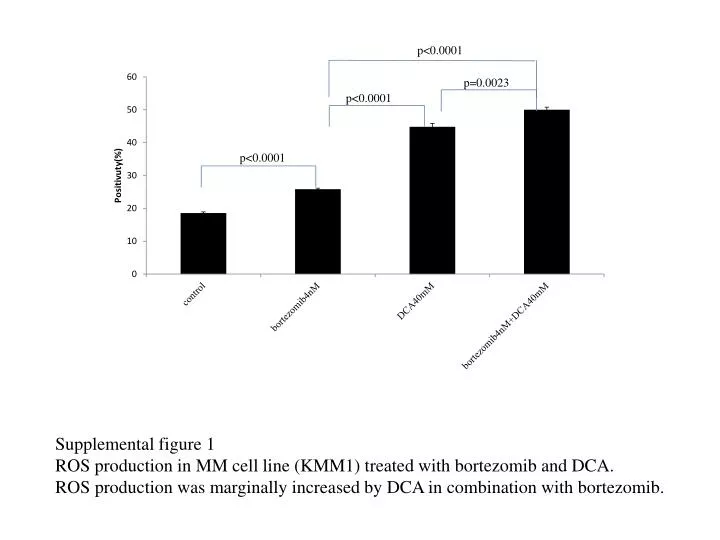
p<0.0001 p=0.0023 p<0.0001 p<0.0001 Supplemental figure 1 ROS production in MM cell line (KMM1) treated with bortezomib and DCA. ROS production was marginally increased by DCA in combination with bortezomib.
(N=27) (N=27) (N=27) (N=27) p=0.84 (log rank) p=0.24 (log rank) Cut off is median (= 4251.795) Cut off is median (= 194.1968) (N=27) (N=27) (N=27) (N=27) p=0.20 (log rank) p=0.29 (log rank) Cut off is median (= 287) Cut off is median (= 9.98) Supplemental figure 2 Overall survival analysis of our cohort which was sub-grouped by expression of glycolysis-related genes except LDH. None of these genes serves as prognostic factor in our cohort.
LDHA (NM_005566 ) PDK1 (NM_002610 ) PDK1 ( AU146532 ) p=0.031 (Log-rank) p=0.9315 (Log-rank) p=0.7987 (Log-rank) HIF1A (TT2, NM_001530 ) GLUT1 (TT2, AI091047 ) GLUT1 (TT2, NM_006516) p=0.1154 (Log-rank) p=0.8554 (Log-rank) p=0.2379 (Log-rank) MYC (TT2, NM_002467 ) MYC (TT2, BF514781 ) p=0.2978 (Log-rank) p=0.6918 (Log-rank) Supplemental figure 3 Overall survival analysis in TT2 cohort (Re-analyzed using data by Zani et al.). Cases were sub-grouped by expression of LDHA, cMYC, GLUT1, HIF1A and PDK1. LDHA was the only prognostic factor.
p=0.0016 p<0.0001 p<0.0001 * p<0.0001 p<0.0001 p<0.0001 Kruskal-Wallis test And Dunn’smultiple Comparison test p=0.9412 p<0.0001 Supplemental figure 4 Expression of LDHA, cMYC, GLUT1, HIF1A and PDK1 in the 8 molecular subgroups of MM utilizing database deposited by Zhan et al. All genes except GLUT1 showed significant heterogeneous expressions. *: LDHA expression of CD2 group was significantly lowest than the other groups.
p=0.0805 p=0.2774 p=0.5309 p=0.1003 p=0.2610 p=0.2806 p=0.9207 p=0.3977 Supplemental figure 5 The association between the expression of LDHA, cMYC, GLUT1, HIF1A and PDK1 in 6 molecular subgroups of human myeloma cell lines utilizing data of Moreaux et al. There was no significant difference in expression of these genes within subgroups.