Download
1 / 20
200 likes | 417 Views
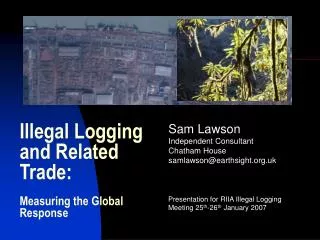
Illegal Logging and Related Trade: Measuring the Global Response. Sam Lawson Independent Consultant Chatham House samlawson@earthsight.org.uk. Presentation for RIIA Illegal Logging Meeting 25 th -26 th January 2007. Are we wasting our time?. Are we wasting other people's money?.

E N D
Illegal Logging and Related Trade: Measuring the Global Response Sam Lawson Independent Consultant Chatham House samlawson@earthsight.org.uk Presentation for RIIA Illegal Logging Meeting 25th-26th January 2007
Are we wasting our time? Are we wasting other people's money? Is any of it making any difference? Should we just go down to the pub?
Where do we start? • Need to examine all phases of response, not just end goal • Need to capture response in terms of role of consumer and processing countries as well as countries suffering illegal logging • Need to examine response by governments and by industry
Problems • Limited information available • Even less comparable information available for different time periods • Data collection methods not precise enough for change to be discerned reliably • Subjective information more plentiful but subject to bias • Different information available for different countries - not comparable
How do other people do it? TI Corruption Index • Uses surveys (subjective opinions turned into quantitative data) • Secondary sources (surveys already conducted by others) • Large datasets (19,000 people - mostly business analysts) such secondary sources don't exist not enough knowledgeable respondents MRAG Illegal Fishing Estimates • One-off measure (not designed to be repeated over time) • Based on 'best guesses' of illegal fishing rates based on very limited data and anecdotal information • Figures then extrapolated using correlations with proxies • Very unreliable; justifiable to get some kind of figure, but not precise enough to measure change over time
Structure of the Study First study - twenty 'indicators' New study - summarised under four main headings: • Awareness • Government Policy Development & Implementation • Private Sector Policy Development & Implementation • Actual Levels of Illegal Logging & Trade Stakeholder consultation meeting to be held in March to discuss draft
Number of news articles with the phrase ‘illegal logging', 1997-2005 A: Awareness • Website usage (eg illegal-logging.info) • Prevalence at international fora (eg CITES, ITTO) • Activity of NGOs • News coverage (general and specialist industry) • Dramatic increase in coverage • But who exactly is it reaching? And what is it about?
Local language news coverage within focus countries • Greatest coverage in Indo, UK, USA • Coverage growing in most countries, esp Indo, UK, Neth, China • Very little in France or Germany compared with UK, Neth • Qualitative analysis important (eg almost no US stories relate to domestic role, most on wire services and very few in major outlets)
B: Government Actions 1. POLICY DEVELOPMENT & IMPLEMENTATION Producer Countries • Collect data against a set of standard criteria • Boolean (yes/no), plus qualitative information • eg: do forest laws recognise traditional rights?; are rules for concession allocation publicly available?; is there formal inter-agency co-ordination? Consumer / Processing Countries • Use same method • eg: have existing legislative options to control imports been analysed?; are CITES controls for timber fully implemented?
2. ENFORCEMENT & IMPLEMENTATION • eg seizures, prosecutions, in producer countries • ideally possible to complete table such as below on annual basis • reality is that information is scattered across time and space and rarely comparable • danger of giving false impressions even if provisos are supplied • more seizures etc could equally mean more or less illegal logging!
3. PROCUREMENT POLICIES Table 12: Consumer country procurement policy development, 2000 – 2006 • Can measure policy progress against set of standard baselines • Measuring implementation and effectiveness more difficult (only UK has any data) • Can get some indications using proxies (eg prices for certified timber)
4. FOREST GOVERNANCE DEVELOPMENT AID • Well known that relevant spending by specific governments and multilateral organisations has grown • Very little data exists with which to prove or measure this, however • Donors do not collate relevant figures and numbers are rarely annualised • World Bank - $310 million FLEG-related project expenditure (no assessment of change over time) • ITTO - non-project work increased from $100k in 2004-5 to $719k in 2005-6
C: Private Sector 1. TIMBER INDUSTRY INITIATIVES • eg FSC, GFTN, TFT, TTAP • good data on take-up showing increase over time of commitment by companies • particularly shows huge increase in numbers of Chinese companies taking action over last two years • BUT very little data collected to show actual implementation eg. GFTN - no information collated; UK only scheme to provide data eg. no data is collected on amount of FSC wood traded by CoC co's • more info should be available in future (eg from TTAP) 2. FINANCIAL SECTOR • Similar issues (policy adoption info, but not implementation) 3. MARKET DEMAND (eg price premiums for cert timber)
Estimates of Illegal Timber Production in Indonesia using Wood Balance modeling, 1997-2005 D: Actual Levels of Illegal Logging & Trade 1. Wood Balance Modelling • often insufficient raw data • different assessments use different methodologies and therefore can't be compared
Prices of Balau Logs, January 2004 – September 2006 Presidential Decree & Enforcement Operation in Indonesia 2. Timber Product Prices • strong correlation between enforcement crackdown in Indonesia and dramatic prices increases for tropical timber in Asia • prices reaching record highs - rises exceed those of early 90s • analysts conclude enforcement main factor behind doubling of share values of listed Malaysian companies with access to legal logs • knock-on effects felt on prices of African species
BUT • other factors involved (eg demand in China, deforestation, Indo sawntimber export ban) - difficult to separate out • econometric analysis needed - may give reverse estimate of scale of reduction in illegal logging in Indonesia • exceptional circumstances - unlikely to provide a useful indicator for other countries in future
Malaysia Tropical Log Trade Data Discrepancies, 1997-2004, volume (000 m3) 2. Trade Data Discrepancies • ITTO studies - can provide an indicator of illegal trade in some cases, but other factors confuse the picture too much in most • Only changes over time clearly correlated are those related to Indo/Mal log and sawntimber trade with major markets • Only potentially useful indicator where trade flow is large; perhaps most useful for assessing imports of illegally-sourced primary products by processing countries (eg China, Malaysia, Vietnam)
So, what about the pub? ? 1. I'm not sure if I can give you an answer... • Insufficient data in most cases • Studies often not repeated • Estimations rarely precise enough to be repeated and compared year-on-year • Extrapolating specific figures from best guesses would be unreliable and potentially misleading • Mostly impractical to collect primary data specifically for this purpose (though limited surveys may be worthwhile) • Qualitative information needs to be captured better • Best option may be annual 'country reports' which combine sparse quantitative data updates with qualitative analysis and survey results
? 2. But if you insist... • Awareness has definitely grown across the board • Definite improvement in commitment and policies in many countries • Actual implementation or effectiveness of policies less certain • Both things also true of private sector • Strong evidence of dramatic reduction in illegal logging and associated trade in Indonesia • Better information likely to be available in future So sorry, not just yet..
Illegal Logging and Related Trade: Measuring the Global Response Sam Lawson Independent Consultant Chatham House samlawson@earthsight.org.uk Presentation for RIIA Illegal Logging Meeting 25th-26th January 2007